Heatmap, heatmap everywhere. They are an intuitive way to visualize information from complex data. You see them showing gene expression, phylogenetic distance, metabolomic profiles, and a whole lot more. In this tutorial, we will show you how to perform hierarchical clustering and produce a heatmap with your data using BioVinci. It’s real easy!

Step 1: Prepare and import data
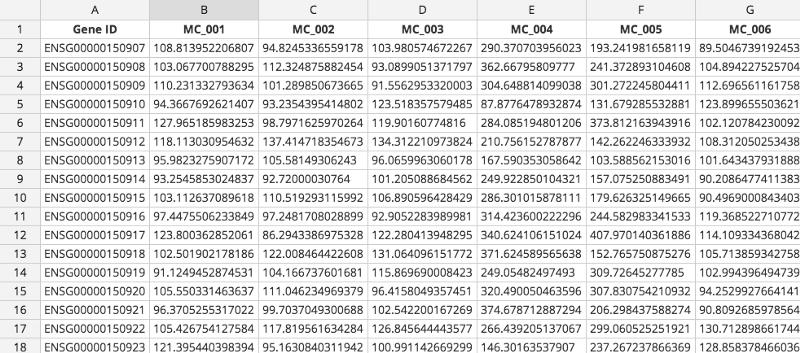
BioVinci supports TSV, CSV and Excels files. You just need to make sure that all numeric columns in the table are appropriate to calculate distances. This function automatically excludes all categorical columns. Note that BioVinci always cluster by columns, so make sure they are set up correctly.
Open BioVinci -> Create new work set -> Drag and Drop file here. Choose the file you want to cluster.
Once the file is uploaded, you will be prompted to name the workset. After that, hit Analyze your dataset. The analysis screen will look like this:
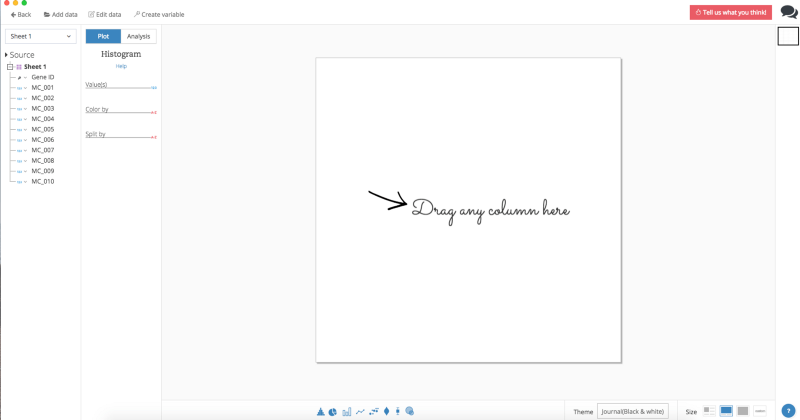
In the Analysis window, click Analysis, then select Hierarchical clustering. Or, type the name of the function in the search box.
There is a Source list on the left that shows the data table and its columns that you’ve just imported. From here, you can drag the whole table, or select multiple columns to cluster. You can also edit the source table by clicking Edit data (top left).
Step 2: Set up parameters for hierarchical clustering
Drag your data (either the whole table or selected columns) to the Matrixplaceholder. You are now ready to set parameters for your clustering.
Clustering method
You can choose among Ward’s minimum variance, Complete linkage, Single linkage, UPGMA, and WPGMA. This will determine how BioVinci calculates the distance between clusters.
Distance method
This lets you pick the appropriate metric space for calculating the distance between variables, among Euclidean, Maximum, Manhattan, Canberra and Binary distance.
Cluster by Column
BioVinci always performs clustering by columns. You can choose to show a dendrogram on the plot or not.
Cluster by Row
Here you can specify if you want BioVinci to perform clustering by rows, either with or without displaying the dendrogram.
Log transform
This gives you the option to apply log transform for all values. If you select Scaling or Centering, the software will automatically apply log transform before running these functions.
Transpose matrix
This option will transpose the original data table into a new matrix whose rows are the columns of the original. BioVinci will then perform the function on the newly transposed table.
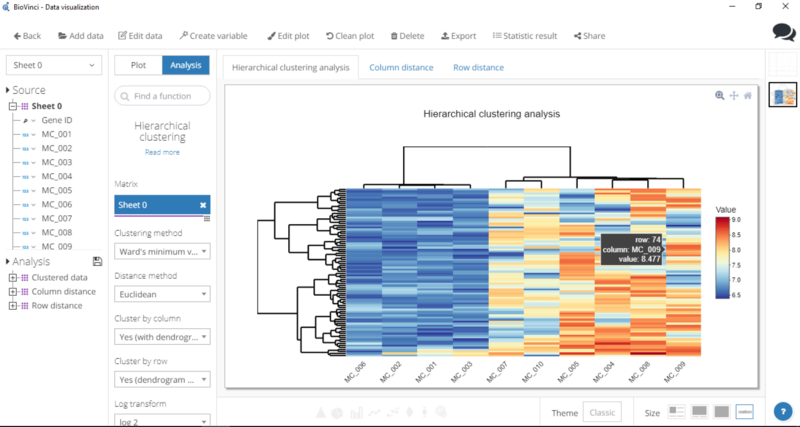
After you’re done setting up all the parameters, hit Run and voilà, there’s your heatmap.
Step 3: Polish the heatmap
Click Edit plot (top of window) — this will allow you to adjust the height and width of the heatmap, edit plot title, change color scheme, and tweak around with axes.
Step 4: Collect your goodies!
Save your work by clicking Save plot. BioVinci will present clustering results in both heatmaps and tables.
You can view the heatmaps by clicking the tabs right above the plot. To view the tables of clustered data, select Statistic Result (top of window).
There you have it! For more tips and tricks, check out our full user guide. Still have questions? Leave a comment, we’ll get back to you right away.
Stephany
Great post.
Marita
Hi there! Such a nice write-up, thanks!