In this blog, we introduce Venice a non-parametric approach for finding marker genes in single-cell RNA-seq data. Using a widely adopted benchmarking approach (Wang et al. 2019), Venice obtains the best accuracy among 14 other tools. Venice is also the fastest tool among all the benchmarked methods.
Venice is open-source, and freely available for academic entities. Venice is now incorporated in Signac, a single-cell analytics package developed by BioTuring. The package is available at https://github.com/bioturing/signac.
1. Problems in the current methods
To find marker genes in single-cell RNA-seq data, Seurat (including SeuratPoisson, Seuratnegbinom, and SeuratT), CellRanger, EdgeR, limmatrend find differentially expressed genes between a small group of highly homogeneous cells to the rest of the data (the outside group), and assume a specific type of distribution on the gene expression. We believe these approaches for finding marker genes in single cell data have flaws.
First, with the high heterogeneity level of single-cell data, the outside group can have multiple separated clusters. This makes the assumption that the gene expressions of the outside group belong to a specific distribution invalid.
Second, these methods use a conventional definition of differentially expressed genes: genes with different mean expression values. However, in many single-cell data sets, there can be clusters with an intermediate expression level that are frequently observed in transitional-state cells. When this transitional cluster is compared against the rest of the data that contain both up- and down-regulated genes, the mean expression values may not be distinguishable. Hence, these transitional genes are invisible to those differentially-expressed gene procedures.
2. Venice: finding marker genes with accuracy using a non-parametric test
To address these challenges, we first defined marker genes of a group of cells in a data set as the genes that can be used to distinguish such cells from the rest. From this idea, we used the accuracy of classification as a metric to score the significance of a marker gene.
Considering each gene separately, we denote a cell as (X, U) where X is the label of a group of cells. X=1 if the cell is in the group of interest (group 1 – the group that we want to find the marker genes for). X=2 if the cell is not in the group of interest (group 2 – the rest of the data). We denote as the complement group of X.
The probability for a cell being in group X, given its expression level U is:
In most of the cases, the group of interest is much smaller than the rest of the data and can generate a sampling bias. To avoid this bias of sample size, we set:
Hence:
Accuracy of the classifier is:
The accuracy of prediction is:
Intuitively, . For the robustness of the calculation, we divide the expression U into k intervals:
Where $n_i$ is the number of cells of group X in group $U_i$, and N is the number of cells in group X. For each gene, we can estimate the accuracy measure for using this gene to predict cells inside or outside the cluster and use this as a metric for ranking the marker genes.
3. Preliminary results
To validate the performance of Venice, we benchmarked it with 14 widely-used methods for marker gene detection. To select the 14 differential expression (DE) methods, we selected the best candidates from a recent benchmark by Sonesson et al. (2018). Adopting the simulated method in Sonesson et al. 2018 for controlling the false positive genes, we simulated 87 instances of data that does not contain any marker genes from 8 real single-cell RNA-seq datasets. Since we only filtered DE genes with the adjusted p-values lower than 0.05, we expected that the fraction of called genes should be equal or lower than the imposed level 0.05. Venice, limmatrend, and metagenomeSeq show the smallest median FDR in all datasets. ROTScpm is the only method that has FPR close to 0.05. Other methods control the FPR below the imposed level.
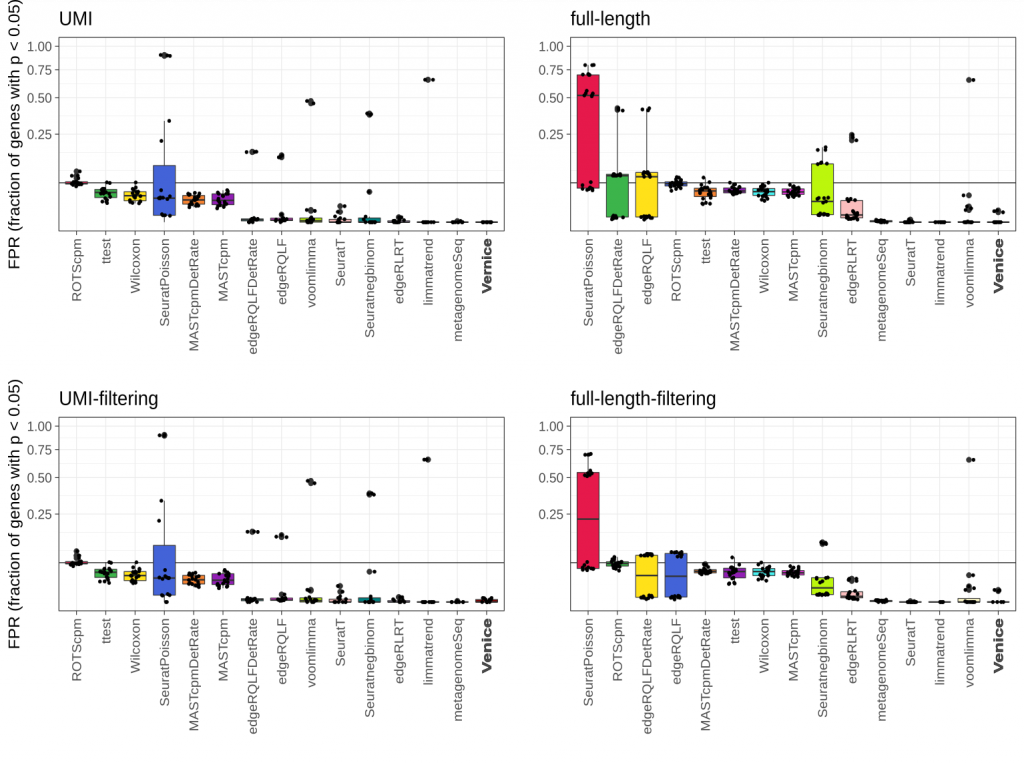
Figure 1. Type I error control across 87 instances from eight real single-cell null data sets. The black line indicates the target FPR = 0.05 and the y-axis is square-root transformed for increased visibility. Centerline, median; hinges, first and third quartiles; whiskers, most extreme values within 1.5 interquartile range (IQR) from the box. The benchmark was adopted from Sonesson et al. (2018).
Further, we want to address the heterogeneity issue in marker gene detection. We simulated 4 different kinds of DE genes and 2 kinds of null DE genes in these datasets using scDD package (Korthauer et al. 2016). This package can simulate the gene expression patterns that resemble transitional stages in cell differentiation.
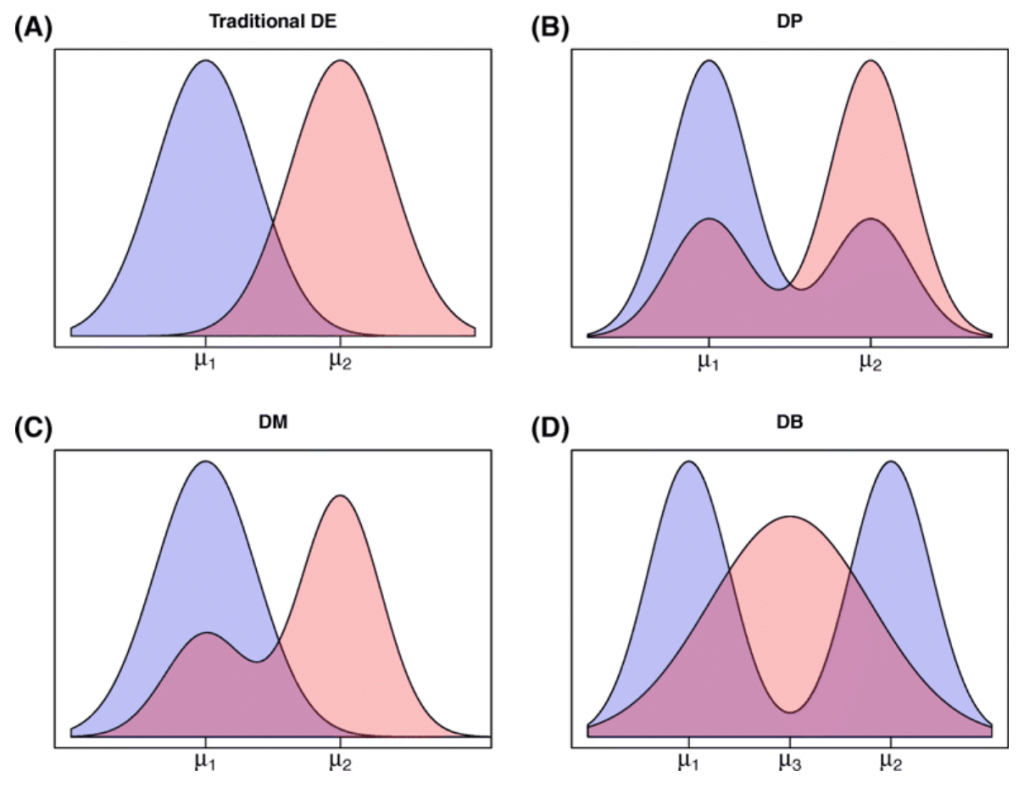
Figure 2. (taken from Korthauer et al. 2016) Diagram of plausible differential distribution patterns, including (A) traditional differential expression (DE), (B) differential proportion of cells within each component (DP), (C) differential modality (DM), and (D) both differential modality and different component means within each condition (DB).
In order to capture the false positive rate, we also added 2 different kinds of null genes from scDD: (1) expression values that are generated from a negative binomial distribution (EE – equivalent expression) and (2) generated from a two-component negative binomial mixture (EP – equivalent proportions).
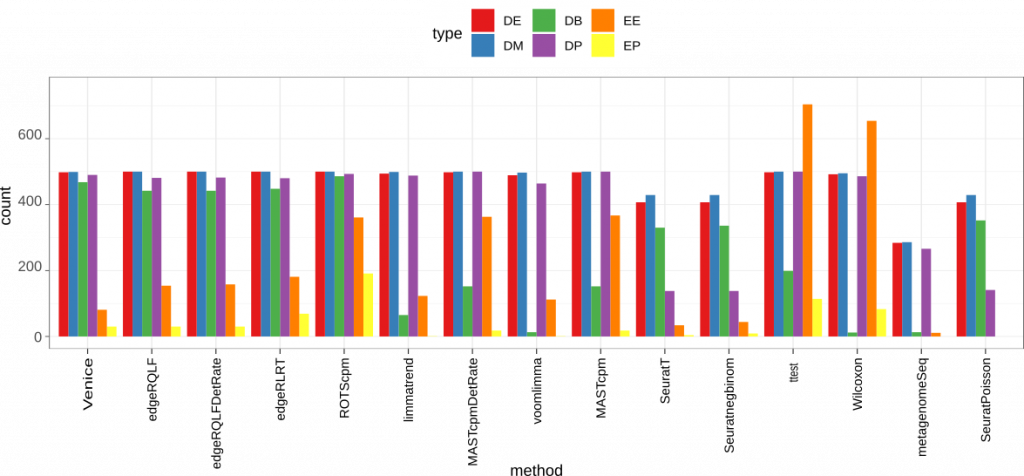
Figure 3. Accuracy on the simulated data. We use scDD package to simulate a dataset contains 2000 differential expressed genes (DEG) that span across four groups: DE, DB, DM, DP. The dataset also has 18000 non-DEG of types EE or EP.
Among 15 methods, t-test and Wilcoxon gave the highest false positive rate. These two methods also showed poor performance on DB genes, which is expected since the means and mean ranks are similar in these genes. Seurat methods (including SeuratPoisson, Seuratnegbinom, and SeuratT) and metagenomeSeq are among the worst in general when detecting the 4 different types of marker genes. But they all had low false positive rate on both EE and EP genes. Interestingly, Venice and egdeR methods (including edgeRLRT, edgeRQLFDetRate, and edgeRQLF) gave the best result on all 4 types of marker genes. Venice also had a lower false positive rate compared to edgeR methods.
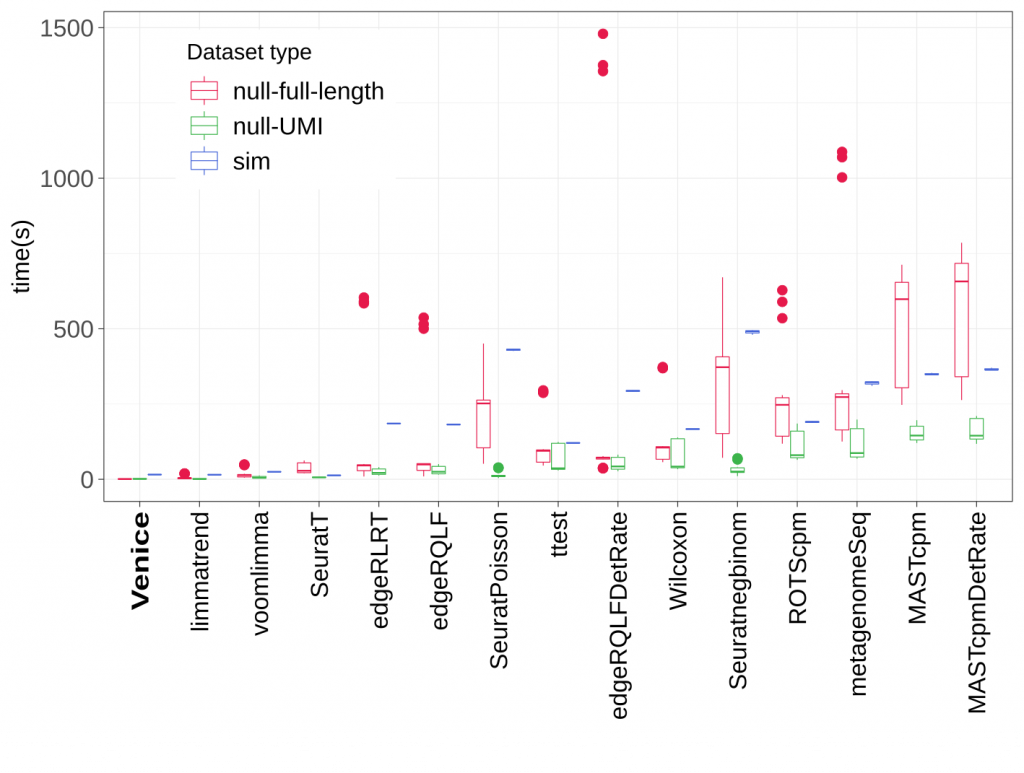
Figure 4. Running time (in seconds) of all methods.
In running time, Venice outperformed all other methods in both real and simulated datasets. It only took less than 10 seconds on average to detect the marker genes for a group of cells.
In conclusion, we tested Venice on both real and simulated datasets. The benchmark considered the performance on 2 different sequencing technologies (full-lenght and UMI count), 4 different kinds of marker genes (including transitional genes), and 2 different kinds of null genes. Venice exhibited the best performance and accuracy in all cases. It could effectively detect different types of marker genes and avoid false positive results while keeping a modest running time.
Try Venice
Venice is now incorporated in Signac, a single-cell analytics package developed by BioTuring. The package is available at https://www.github.com/bioturing/signac.
The tool is also integrated into BioTuring Single-cell Browser, an interactive visualization and analytics software package for single-cell sequencing data.
References
Korthauer, K. D., Chu, L. F., Newton, M. A., Li, Y., Thomson, J., Stewart, R., & Kendziorski, C. (2016). A statistical approach for identifying differential distributions in single-cell RNA-seq experiments. Genome biology, 17(1), 222.
Wang, T., Li, B., Nelson, C. E., & Nabavi, S. (2019). Comparative analysis of differential gene expression analysis tools for single-cell RNA sequencing data. BMC bioinformatics, 20(1), 40.
—
Venice was previously named "Harmony". However, "Harmony" is also the name of an innovative and effective approach to correct the batch effects in scRNA-seq data, developed by Korsunsky and colleges. In respect of their contribution, we officially changed the name of our method to "Venice" – an artwork of Signac.
Kevin Leiss
Interesting work, I would love to test it, but the GitHub repo is not available.
biomembers
Hi Kevin, thanks for your interest! We are revising the license terms and will open it soon tomorrow. Will let you know when it is ready.
biomembers
Hi Kevin, the repo is now open. Please have a look.
Samuele Soraggi
Very interesting work. How does it perform with data integrated from different datasets?