6 best box and whisker plot makers
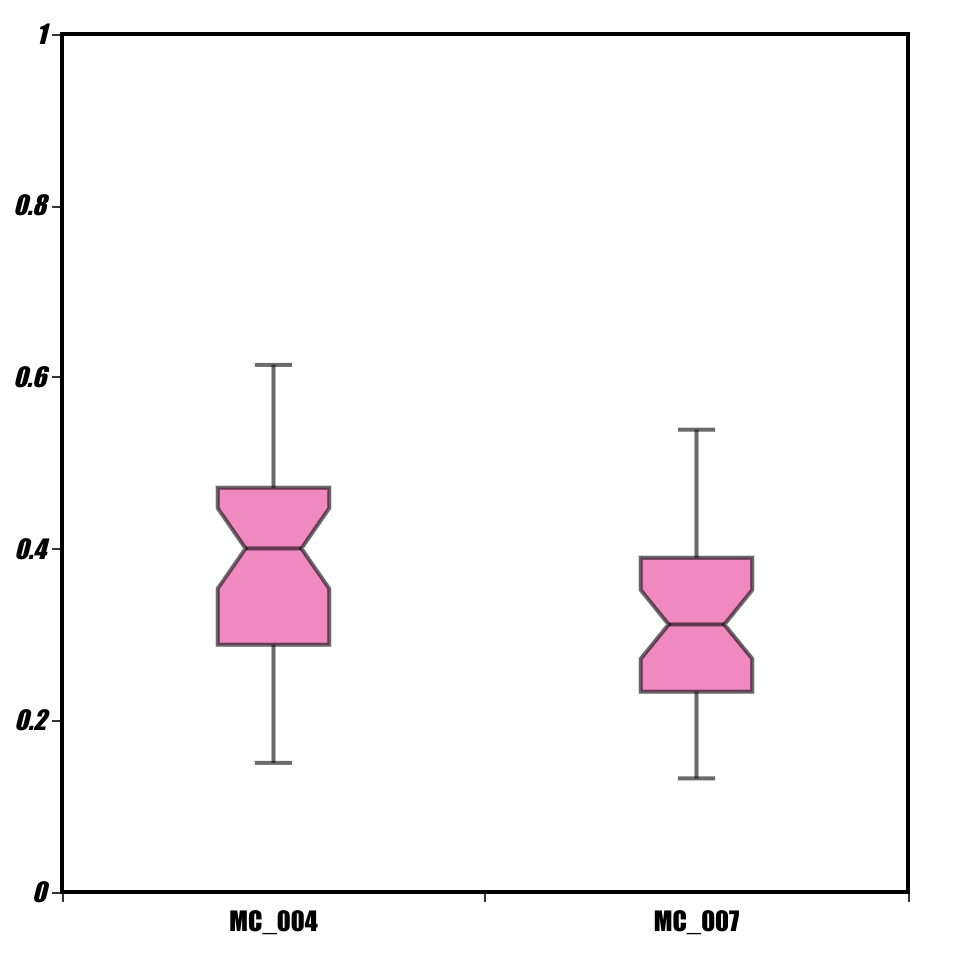
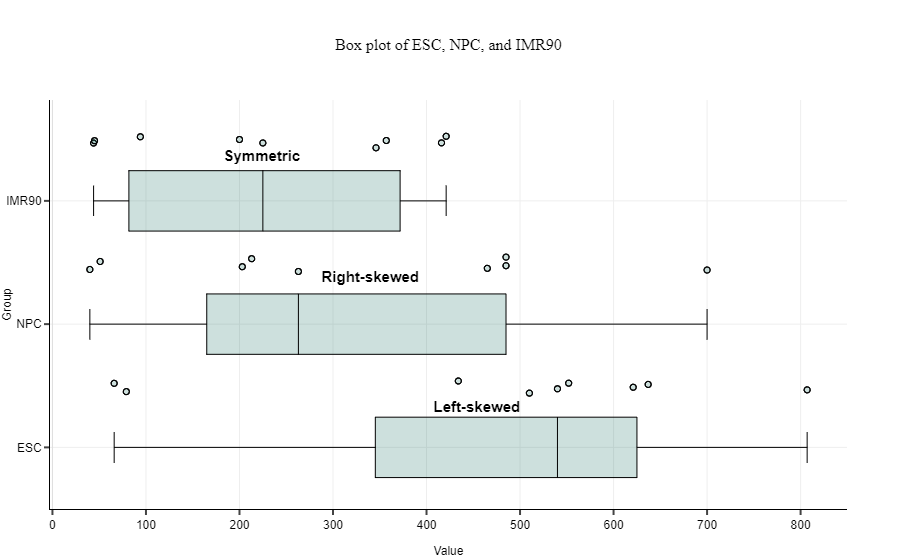
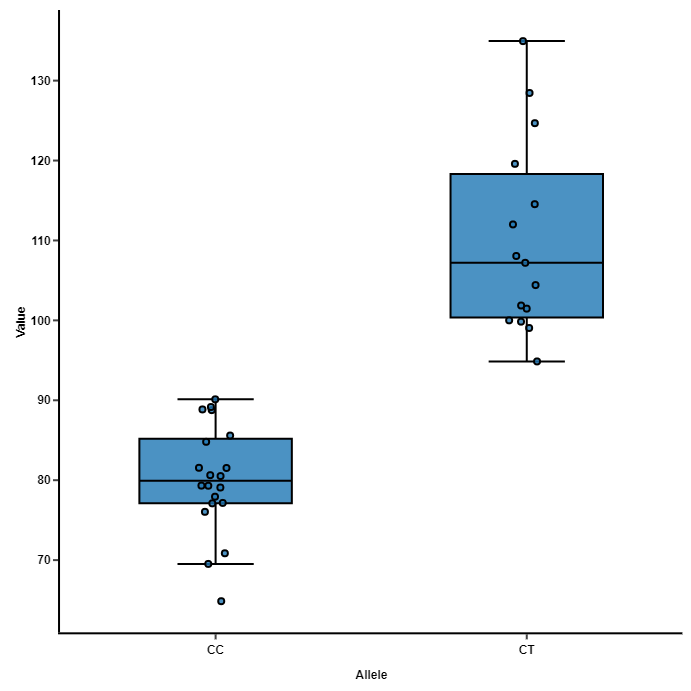
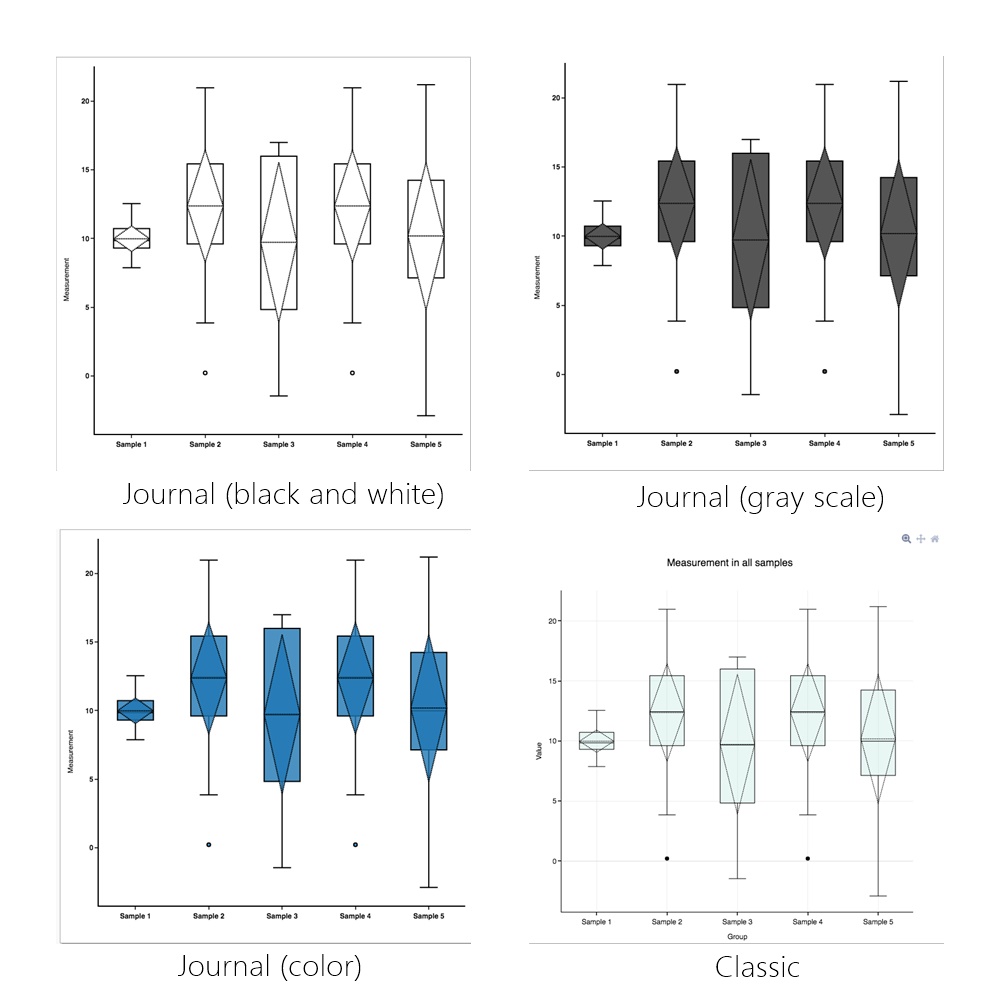
A box and whisker plot, or just box plot, is a graph that visualizes how spread-out a dataset is. A box plot displays 5 values: minimum, first quartile, median, third quartile, and maximum. How to read a box plot: The box is drawn from the first quartile to the third […]