Today we finished the first version of Hera-T, a new single-cell RNA-seq quantification algorithm. We developed Hera-T by improving challenging alignment errors that Cell Ranger has. As a result, Hera-T is more accurate than Cell Ranger. Hera-T is more than 10 times faster than Cell Ranger, while consuming just a small amount of memory (~6GB). For Nuclei_900 data with 48 million of reads, Cell Ranger took more than 1 hour while Hera-T took 2 minutes; for pbmc4k data with 379 millions of reads, Cell Ranger took more than 4.5 hours (260 minutes) while Hera-T took 16 minutes.
Hera-T addressed the following problems that Cell Ranger encounters.
1. Mapping splicing reads
Reads that span across small exons
When reads span across multiple exons, they scatter into multiple fragments in the genome coordinates. We observe that when one of these fragments (exons) is small, Cell Ranger fails to detect correct alignments. As Cell Ranger maps reads to the genome using k-mers for seed identifications, it cannot detect seeds in small regions in the genome (corresponding to small exons). For these reads, in many cases, Cell Ranger either fails to map, or maps them to another locus on the genome with a lower alignment score, or cannot detect the exon splice (reads are mapped across exon boundary into intronic regions instead of skipping the intronic region) (Figure 1).
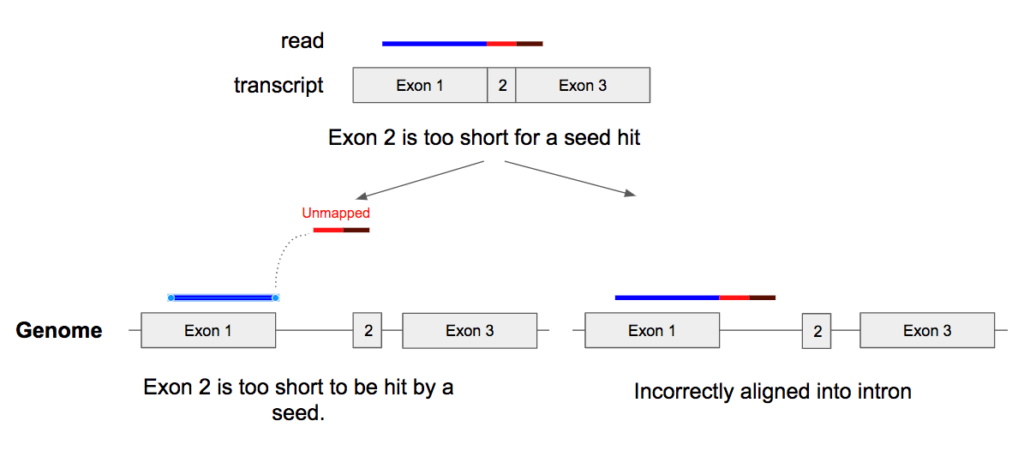

Figure 1. When a read spans across multiple exons, it is ‘spliced’ into small fragments, making it difficult to align correctly on the genome coordinate.
Splicing appears near read terminal
Similar to the short exon case, when the splicing positions are near the read terminal, the end fragment of the read can’t be hit by a seed. We observe that Cell Ranger also fails to align in this scenario and usually extends the alignment into the adjacent intron (Figure 2).
Errors (SNP) in reads conceal the correct anchor exons
When mapping transcriptome reads on a reference genome, SNP or errors in reads can make it difficult to find the anchor seeds of reads on exons, especially short exons. This leads to incorrect alignment.
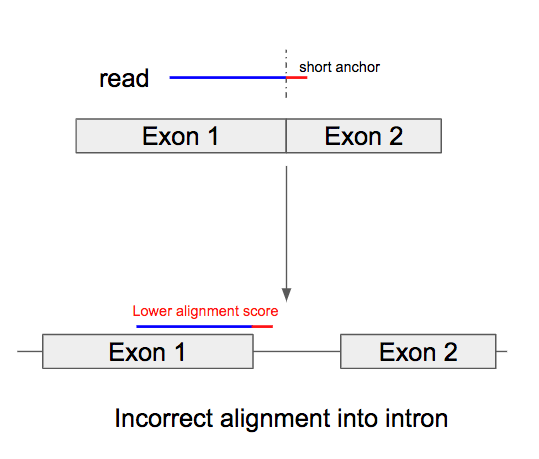

Figure 2. Splicing appears near read terminal
2. Multiple mapped loci report
While using Cell Ranger on several data sets [e.g., 2k Brain cells from an E18 mouse] we found that there were some strange errors in reads that can map equally well to multiple locations. Some reads that map perfectly to multiple positions on the genome are reported only once by Cell Ranger. We think this is a bug in the alignment tool that Cell Ranger uses.
To replicate this scenario, you can run Cell Ranger on the following dataset of 2k Brain Cells from an E18 Mouse. https://support.10xgenomics.com/single-cell-gene-expression/datasets/2.1.0/neurons_2000.
Take a look at this read:
@ST-K00126:491:HMV7GBBXX:2:2201:29812:36376
With sequence:
GATAAAGGTTGATGACAACAAGAAACTAGGGGAATGGGTAGGCCTCTGTAAAATCGATCGAGAGGGCAAACCACGGAAGGTGGTTGGTTGCAGTTGCG
This read maps perfectly to the following positions:
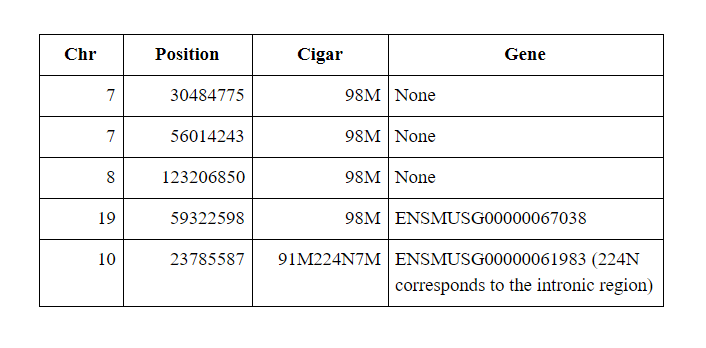

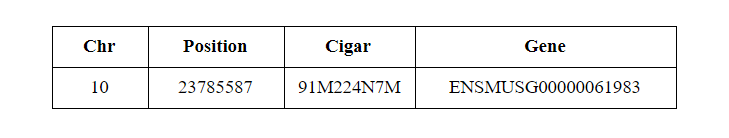
Yet Cell Ranger reports just one position:

Hera-T has addressed all these problems. When we remove all these problematic reads described above and reads with high error rates (reads with > 5 mismatches) Hera-T and Cell Ranger produce almost identical results (~ 0.999 for both Pearson and Spearman scores for pbmc4k).
While performing very careful alignment, Hera-T keeps the speed and memory highly comparable to pseudo-alignment approaches, and is more than 10x faster than Cell Ranger.
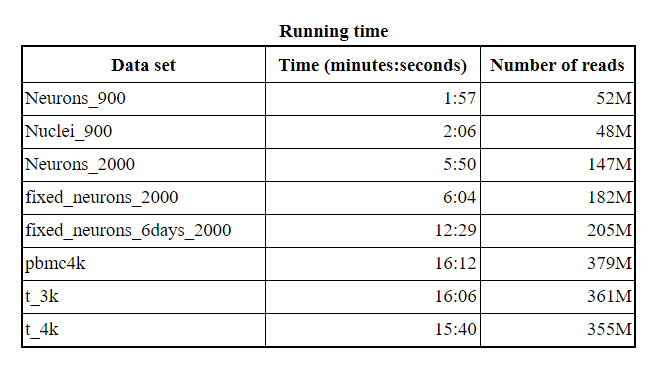
Hera-T keeps the speed and memory highly comparable to pseudo-alignment approaches (data: https://support.10xgenomics.com/single-cell-gene-expression/datasets)
We haven’t got enough time to wait for the Cell Ranger to finish for all data sets, but for data Nuclei_900 with 48 million of reads, Cell Ranger took more than 1 hour while Hera-T took 2 minutes; for data pbmc4k with 379 millions of reads, Cell Ranger took more than 4.5 hours (260 minutes) while Hera-T took 16 minutes (Cell Ranger data are provided on 10xgenomics website). For the above data sets, Hera-T used about 6 GB of memory. The above benchmark was applied on a 32-core CPU machine.
Hera-T will soon be integrated into BioTuring Browser to allow single-cell analysis on standard laptops.
Below are the Spearman, Pearson, Log pearson scores of Hera-T and Cell Ranger using multiple data sets.
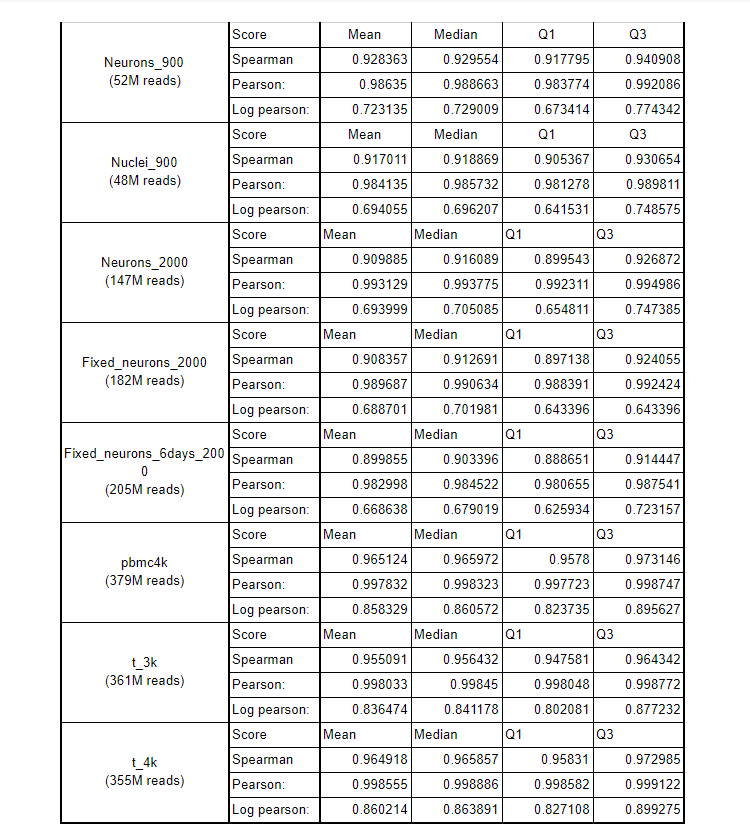
Spearman, Pearson, Log pearson scores of Hera-T and Cell Ranger
BioTuring Team