We are glad to announce that we will upsize the current single-cell database in BioTuring Single-cell Browser to 5,500,000 cells this September. With this release, we will double the current number of publications indexed in BioTuring Single-cell Browser, and cross the number of cells hosted on available public single-cell data repositories like Human Cell Atlas (HCA) and Broad Institute’s Single-cell Portal.
What single-cell data sets are coming?
Out of 5.5 million cells to be indexed this time, our single-cell database covers a broad range of tissues, diseases, and research fields. Highlighted studies include:
- Datasets under Human Cell Atlas project, such as the Census of Immune Cells (Lee et al., 2019) and the atlas of 1.5 million CD34+ cells from human bone marrow to understand hematopoiesis (Kiseliovas, 2019)
- Intra- and Inter-cellular Rewiring of the Human Colon during Ulcerative Colitis (Smillie et al., 2019)
- A Cellular Taxonomy of the Bone Marrow Stroma in Homeostasis and Leukemia (Baryawno, 2019)
- Clonal replacement of tumor-specific T cells following PD-1 blockade (Yost et al., 2019)
- A single-cell atlas of mouse brain macrophages reveals unique transcriptional identities shaped by ontogeny and tissue environment (Van Hove et al., 2019)
- Single-cell transcriptomic analysis of the lateral hypothalamic area reveals molecularly distinct populations of inhibitory and excitatory neurons (Mickelsen et al., 2019)
- A Cancer Cell Program Promotes T Cell Exclusion and Resistance to Checkpoint Blockade (Jerby-Arnon et al., 2018)
210,614 immune cells from “Intra- and Inter-cellular Rewiring of the Human Colon during Ulcerative Colitis”, a work by Smillie and colleagues (2019) at Broad Institute
In this release, we will also upload new comprehensive atlases in the immune system, especially in the tumor microenvironment, say the atlas of infiltrating T cells in liver cancer (Zheng et al., 2017), lung cancer (Zilionis, 2019), basal and squamous cell carcinoma (Yost et al., 2019) with detailed cell type annotations, making a valuable source for reference and meta-analysis in immuno-oncology research.
Transforming the way we explore published single-cell data
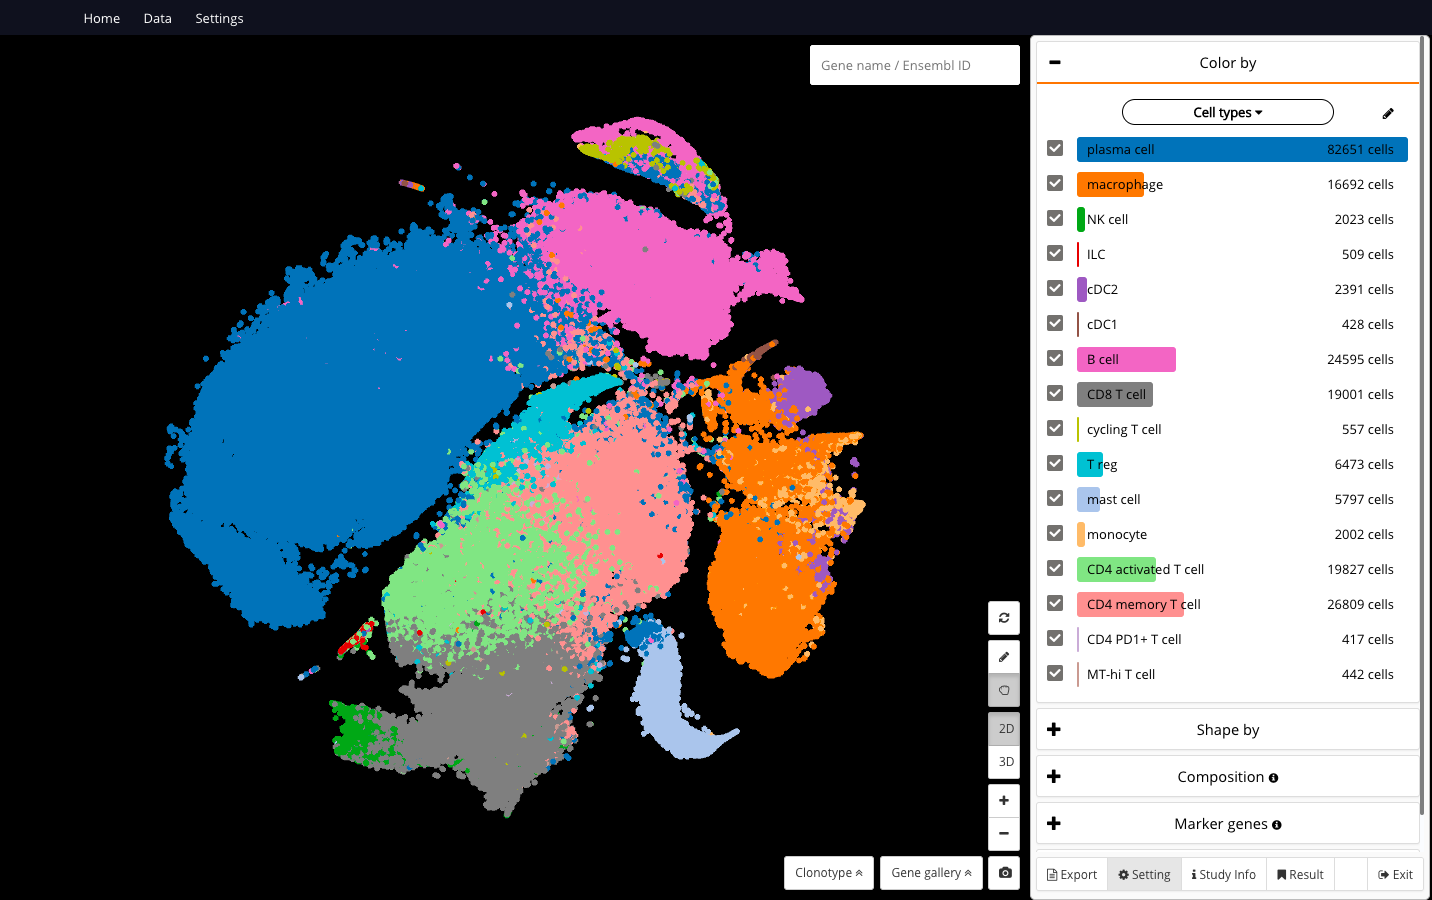
With this constantly expanding database and analytics platform, we aim to make a comprehensive transcriptomic library of every cell line and enable any biologists to take full advantage of these valuable published data in the easiest way. Not just seeing the dataset and its annotations in one click, with BioTuring Browser, you can easily predict cell types in real-time, find marker genes and subsets, study compositional changes, and find differentially expressed genes between any two cell populations.
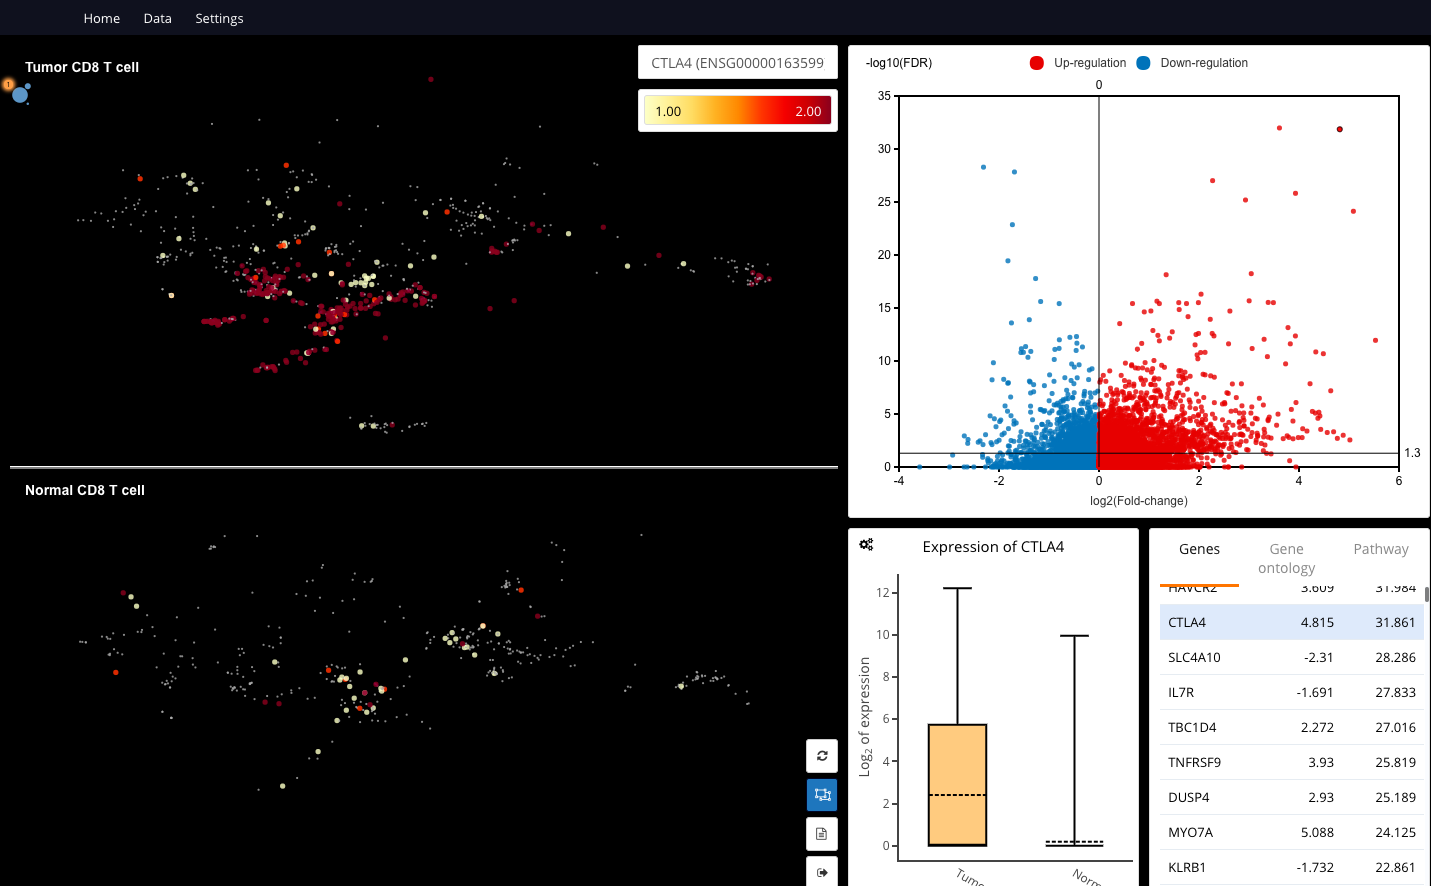
Differential expression analysis between tumor vs. normal CD8 T cells. Data are taken from “Landscape of infiltrating T cells in liver cancer revealed by single-cell sequencing” (Zheng et al.,2017)
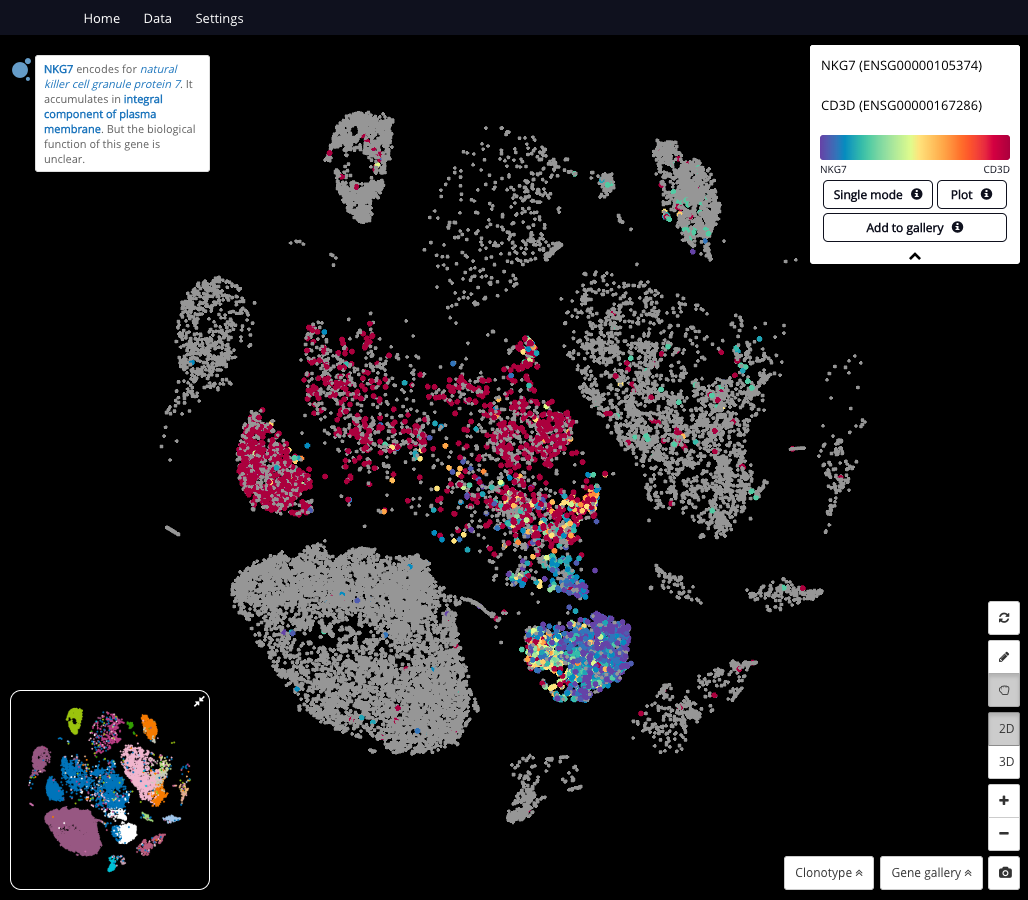
Querying 2 marker genes of natural killer cells and T cells in the dataset “Single-Cell Transcriptomics of Human and Mouse Lung Cancers Reveals Conserved Myeloid Populations across Individuals and Species” (Zilionis, 2019)
When is it available?
This single-cell database will be up in September 2019 in BioTuring Single-cell Browser, available at https://bioturing.com/product/bbrowser.
Following the release, we will have a series of blog posts and videos to reproduce the findings in key publications, and walk you through the dashboards in BioTuring Single-cell Browser.
To be the first to know when it’s out, just sign up for this form. Don’t forget to let us know your research field so that we can send you the full list of upcoming datasets that might be of your interest.
Cheng
I have bought member. But I need to change the account to the new computer. Why it would be allowed? How to solve it? Thanks