Cancer treatment, as challenging as it sounds, has been revolutionized by recent advances in immune checkpoint blockade (ICB) therapies, which use monoclonal antibodies (mAb) to block the suppressive immune checkpoints, helping the patient’s immune system to kill cancer cells. However, despite several clinical case studies of success, some patients still do not respond well or not at all to these therapies.
What could be an explanation to these negative responses?

Figure 1: Illustration of PD-1 checkpoint blockade.
One promising way to answer the question is to fully characterize the heterogeneity and dynamics of tumor infiltrating lymphocytes (TILs) before, during, and after ICB for cancer treatment. Thankfully, with recent advances in single-cell sequencing technologies, the landscape of tumor TILs in immunotherapy has been gradually completed at an unprecedented resolution, shedding light on the immune system dynamics and its relationship with clinical responses in specific groups of patients (Tirosh et. al., 2016; Clark et. al., 2019; Yost et. al., 2019, etc.)
In this work, we use multiple single-cell transcriptome data sets from BioTuring Browser to highlight shared perspectives on using the TIL landscape for predicting response to immunotherapy. We focus, in particular, on CD8+ T cells, a very complex and dynamic population that has shown to impact clinical responses in specific patient groups.
Enrichment of exhausted CD8+ T cells in non-respondents
Sequencing more than 16,000 immune cells in melanoma patients, Sade-Feldman & Yizhak et. al. (2018) provided a detailed picture of the TILs’ heterogeneity, especially the CD8+ populations, between respondents and non-respondents to ICB. Their study suggested that non-respondents exhibited a higher fraction of exhausted or dysfunctional CD8+ T cells. The single-cell dataset in this paper was curated and currently indexed in BioTuring Single-Cell Database.
We sought to reproduce this finding and also get some other insights that maybe were not covered by the authors of the study. In order to do that, we first sub-clustered all the T cells in the data and visualized them with UMAP. Surprisingly, the cells’ trajectory on UMAP maps to cell exhaustion levels as shown in Fig. 2a.
The trajectory begins with regulatory T cells, memory T cells, lymphocytes, to exhausted CD8+ T cells that express heat shock proteins, exhausted CD8+, and exhausted T cells that express cell-cycle genes. Interestingly, most cells from responding patients are positioned near the upper bound, while non-responder samples stretch substantially to exhausted/dysfunctional states (Fig. 2a,b,d), and also form a separate cluster (marked by some TRD genes, KLRG1) (Fig. 2c).

Figure 2. Sub-clustering of T cells in the dataset of Sade-Feldman & Yizhak et. al. (2018). (a) UMAP of all T cell sub-clusters shows a transition of T cells from memory to exhausted states. The trajectory begins with regulatory T cells, memory T cells, lymphocytes, to exhausted CD8+ T cells that express heat shock proteins, exhausted CD8+, and exhausted T cells that express cell-cycle genes; (b) T cells colored by responder and non-responder; (c), (d) Log2 (raw expression values) of TRDC and LAG3 (an exhaustion marker)
We next compared cell type proportions between responder and non-responder patients. In this analysis, we found that the total percentage of exhausted CD8+ populations in the non-response group (57.76%) is higher compared to the response group (25.46%) (Fig. 3a,b). These results confirmed the finding from Sade-Feldman et. al. 2018.

Figure 3. Cell type composition of (a) responders and (b) non-responders.
TCF7+ PD-1- CD8+ T cell abundance: a predictive marker for checkpoint blockade outcomes
Sade-Feldman & Yizhak et. al. also pinpointed the transcription factor 7 (TCF7) expression in CD8+ T cells as a predictive marker for immune checkpoint blockade responses.
To find whether this finding is reproducible, we followed the authors’ study to select and sub-cluster the CD8+ T cell populations to just focus on its subsets and dynamics. To select these cells, we used a bi-axial feature plot, graphing cells by CD3+ and CD8+ expression (Fig. 4a) and select the cluster in the middle, containing cells that expressed both genes. After sub-clustering and coloring the CD8+ T cells by responder and non-responder, we identified a special CD8+ T cell subpopulation highly specific to responders (Fig. 4b). We then proceeded to find the marker genes for this population.
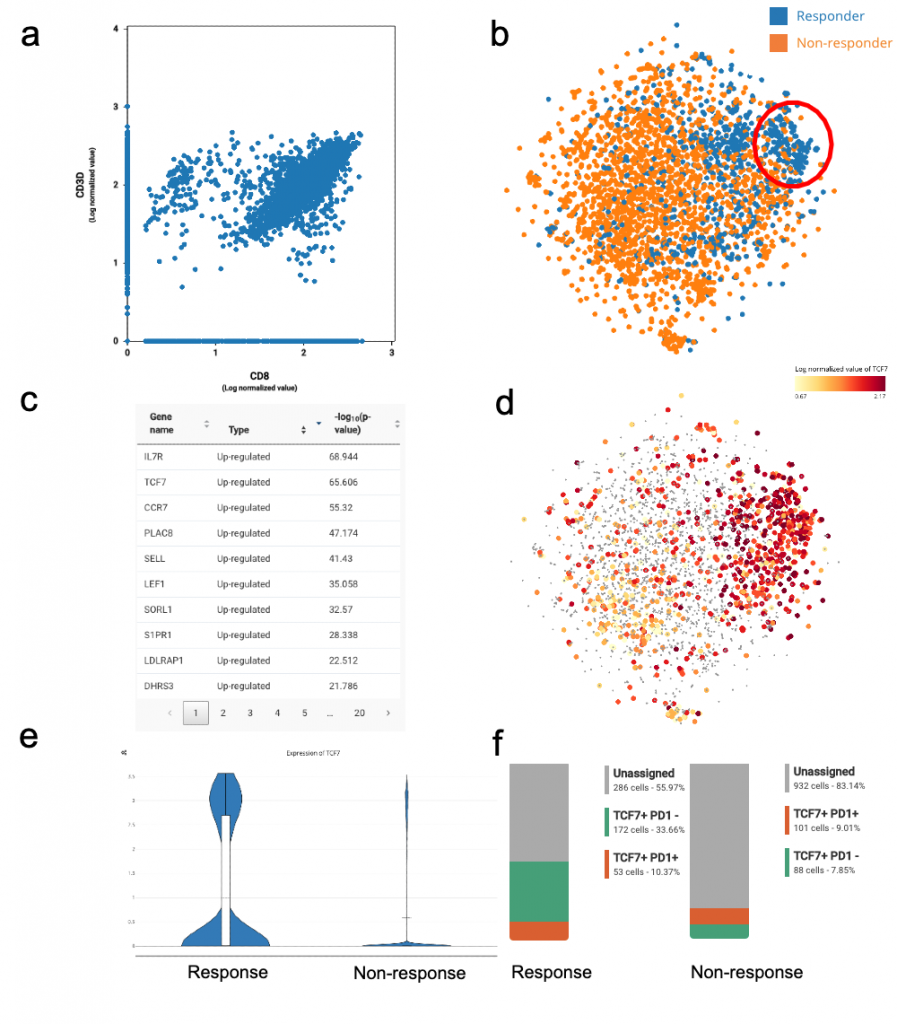
Figure 4. TCF7+ population enriched in respondents pre-treatment.
(a). Feature plot of CD3D and CD8 expression; (b) t-SNE of CD8+ CD3+ cells colored by response and non-response, showing a CD8+ T cell subpopulation highly specific to respondents; (c) list of marker genes for the response-specific CD8+ sub-population; (d) TCF7 expression across all CD8+ T cells; (e) violin plot of TCF7 expression between response and non-response; (f) composition of the TCF7+ response-specific population before treatment of respondents and non-respondents. The percentage of TCF7+PD1- is higher in the response group.
Amongst the list of gene markers, we identified genes related to central memory signatures including CCR7(FDR = 10^-55), IL7R (FDR = 10^-69), LEF1 (FDR = 10^-35), SELL(FDR = 10^-41) and TCF7 (FDR = 10^-65) (Clark et al. 2019) (Fig. 4c,d,e). This signature was also reported by the study. This responder-specific CD8+ T cell subset also downregulates exhausted/ dysfunctional gene signatures (examples of genes are: PDCD1, LAG3, HAVCR2, TIGIT).
Notably, TCF7, which is part of the Wnt/ b-catenin signaling pathway, was previously known to reinvigorate CD8+ T cells in response to PD-1 blockade to resolve chronic infection (Im et al., 2016; Utzschneider et al., 2016). Zhou et al. (2010) also suggested that the gene was crucial for differentiation, self-renewal, and persistence of memory CD8+ T cells, which could potentially explain its link to favourable clinical responses of ICB in melanoma.
In addition, we also found that the TCF7+ PD-1- population was enriched in the pre-treatment phase of respondents (accounting for 33.66% of the total CD8+ T cells) (Fig. 4f). This suggested that abundance of TCF7+ PD-1- CD8+ T cell populations before treatment could predict a favorable outcome of ICB.
Is TOX a useful predictor for PD-1 blockade?
TOX (Thymocyte Selection Associated High Mobility Group Box) has been shown to promote T cell exhaustion (Khan et. al., 2019; Seo et. al., 2019). TOX could impair CD8+ T cell anti-tumor function and response to anti-PD1 therapy (Wang et. al., 2019). A recent study by Kim et. al. (2020) also confirmed that the expression levels of TOX in tumor infiltrating T cells could predict response to anti-PD-1 therapy in human melanoma and non-small-cell lung cancer, and that TOX inhibition may potentially impede T cell exhaustion and improve ICB efficacy.
We hypothesized that TOX could also link to T cell exhaustion. We verified this assumption using multiple single-cell data sets in BioTuring database. The question we had was how to find single-cell data sets with TOX genes expressed. Fortunately, BioTuring API allows us to perform such a query.
Using BioTuring API, we queried the TOX gene across all cancer related studies. Interestingly, BioTuring database returned exhausted T cells in 4 data sets: Zhang et. al (2018), Sade-Feldman et. al. (2018), Guo et. al. (2019) and Yost et. al. (2019) (Fig 5), where TOX up-regulated in these exhausted T-cell populations.

Figure 5: High TOX expression in T follicular helper cell (Tfh) and exhausted T cell populations in the single-cell dataset of Yost et. al. (2019).
Next, we used the dataset of Sade-Feldman to study TOX expression in CD8+ T cells of respondents vs. non-respondents, before and after ICB. Interestingly, we noticed an increase of expression in non-respondents before treatment (p=3.13e-07) (Fig 6). TOX-positive cells shared 59.14% of the total CD8+ T cells in non-respondents, while accounting for 42.86% in the response group. Altogether, our reanalysis of the database confirms TOX’s link to T cell exhaustion, and its potential role as a predictive marker for non-response.

Fig 6: Student’s t-test of TOX expression between non-respondents and respondents before ICB (performed with BioVinci).
Above are some reproducible insights into the TIL dynamics under ICB, reanalyzed using BioTuring’s public single-cell data repository. We hope this helps to confirm the findings in a data-centric approach for other studies such as this one, and at the same time provides more insights into the CD8+ T cell dynamics under immune checkpoint blockade. Further analyses into phenotype-clonotype stability and clonal replacement of exhausted CD8+ T cells following PD-1 blockade will soon be coming in the next episode. These insights are really important to better understand the dynamics in immuno-oncology therapies and to understand why groups of patients are better responders than others.
References:
Clarke, James, et al. "Single-cell transcriptomic analysis of tissue-resident memory T cells in human lung cancer." Journal of Experimental Medicine 216.9 (2019): 2128-2149.
Guo, Xinyi, et al. "Global characterization of T cells in non-small-cell lung cancer by single-cell sequencing." Nature medicine 24.7 (2018): 978-985.
Im, Se Jin, et al. "Defining CD8+ T cells that provide the proliferative burst after PD-1 therapy." Nature 537.7620 (2016): 417-421.
Khan, Omar, et al. "TOX transcriptionally and epigenetically programs CD8+ T cell exhaustion." Nature 571.7764 (2019): 211-218.
Kim, Kyungsoo, et al. "Single-cell transcriptome analysis reveals TOX as a promoting factor for T cell exhaustion and a predictor for anti-PD-1 responses in human cancer." Genome Medicine 12.1 (2020): 1-16.
Kurtulus, S. et al. Checkpoint blockade immunotherapy induces dynamic changes in PD-1−CD8+ tumor infiltrating T cells. Immunity 50, 181–194.e6 (2019).
Miller, B. C. et al. Subsets of exhausted CD8+ T cells differentially mediate tumor control and respond to checkpoint blockade. Nat. Immunol. 20, 326–336 (2019).
Siddiqui, I. et al. Intratumoral Tcf1+PD-1+CD8+ T cells with stem-like properties promote tumor control in response to vaccination and checkpoint blockade immunotherapy. Immunity 50, 195–211.e10 (2019).
Tirosh, Itay, et al. "Dissecting the multicellular ecosystem of metastatic melanoma by single-cell RNA-seq." Science 352.6282 (2016): 189-196.
Seo, Hyungseok, et al. "TOX and TOX2 transcription factors cooperate with NR4A transcription factors to impose CD8+ T cell exhaustion." Proceedings of the National Academy of Sciences 116.25 (2019): 12410-12415.
Utzschneider, Daniel T., et al. "T cell factor 1-expressing memory-like CD8+ T cells sustain the immune response to chronic viral infections." Immunity 45.2 (2016): 415-427.
Wang, Xiaochen, et al. "TOX promotes the exhaustion of antitumor CD8+ T cells by preventing PD1 degradation in hepatocellular carcinoma." Journal of hepatology 71.4 (2019): 731-741.
Yost, Kathryn E., et al. "Clonal replacement of tumor-specific T cells following PD-1 blockade." Nature medicine 25.8 (2019): 1251-1259.
Zhou, Xinyuan, et al. "Differentiation and persistence of memory CD8+ T cells depend on T cell factor 1." Immunity 33.2 (2010): 229-240.