Ever questioned why the immune system does not attack our own double-stranded RNA? Speaking of this, we should not ignore the role of ADAR, the gene that encodes Double-stranded RNA-specific adenosine deaminase enzyme, responsible for converting adenosines to inosines (A -> I editing) in double-stranded RNA (dsRNA) substrates. ADAR was found to be involved in the sensing pathway to endogenous double-stranded RNA by Mannion and colleagues in 2014. In that study, Adar1 mutant mouse embryos showed aberrant interferon induction and died by embryonic day E12.5. ADAR is great for maintaining our being, isn’t it?
Not just for our being, but potentially for the “tumor being” as well?
A couple of weeks ago, Ishizuka and colleagues from Haining Lab published their work on the role of ADAR1 in immunotherapy resistance, showing its loss profoundly sensitized tumors to treatment. Using single-cell RNA sequencing on CD45+ immune cells from Adar1-null (Adar1-knockout) and control tumors [and other techniques], the authors were able to compare the immune microenvironment in two models, and detect a significant decrease in the proportion of myeloid-derived suppressor cells (known for suppressing T cell responses) and M2 macrophages (known for tumor promotion) in Adar1-knockout. Interestingly, up-regulated genes are highly enriched in the biological process “respond to type I interferon”.
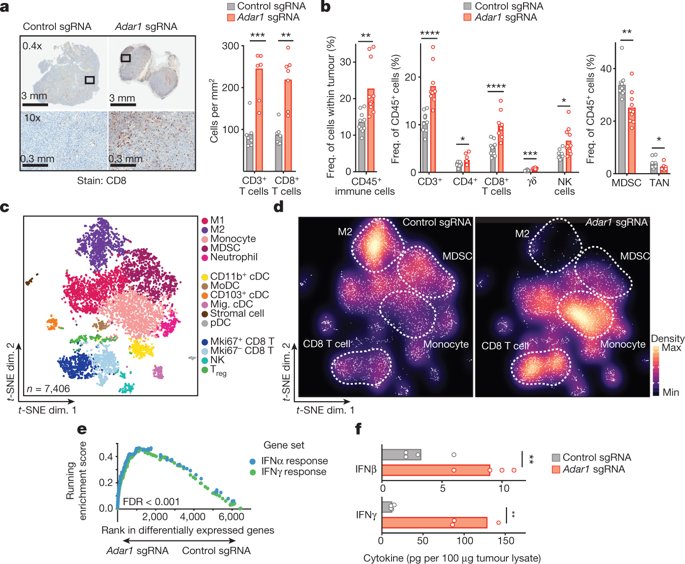
Source: Ishizuka et al. 2018
Such an amazing work gained so much interest from the scientific community. We have received a lot of requests to index the single-cell RNA-seq dataset of this paper into BBrowser. Now the data are ready. Below, we provide details on how we reproduce findings in this paper using BBrowser. This includes the text guide as well as a screencast video.
1.The experimental design
In a previous work from Haining lab, Manguso et al., 2017 identified Adar1 as one of the genes with a potential to modify the response to endogenous RNA species.
This time, Ishizuka and colleagues showed Adar1 functions as a checkpoint that limits anti-tumor immunity by preventing the sensing of endogenous dsRNA. This paper performed single-cell RNA sequencing on CD45+ immune cells from Adar1-null and control tumors (implanted into C57BL/6 female mice) – to compare the immune microenvironment of these two models. The authors also added B16 tumor cells grown in culture to each sample at a 5% ratio as a spike-in control for assessing sample-to-sample variability. The total 8834 cells (including both infiltrating immune cells and spiked-in tumor cells) were counted and loaded into the 10xGenomics device.
2. Marking the spiked-in tumor cells
As the main interest of the study is the infiltrating immune cell population, we locate and exclude the spiked-in tumor cells in the data.
We, therefore, choose to see the expression of both Pmel and Mlana (markers for tumor cells) in the cell population. Cells with high Pmel expression are in red, while cells with high Mlana expression are in blue. Cells that express both genes are marked in yellow. The yellow cluster on the left of the t-SNE plot corresponds to the spiked-in tumor cells.
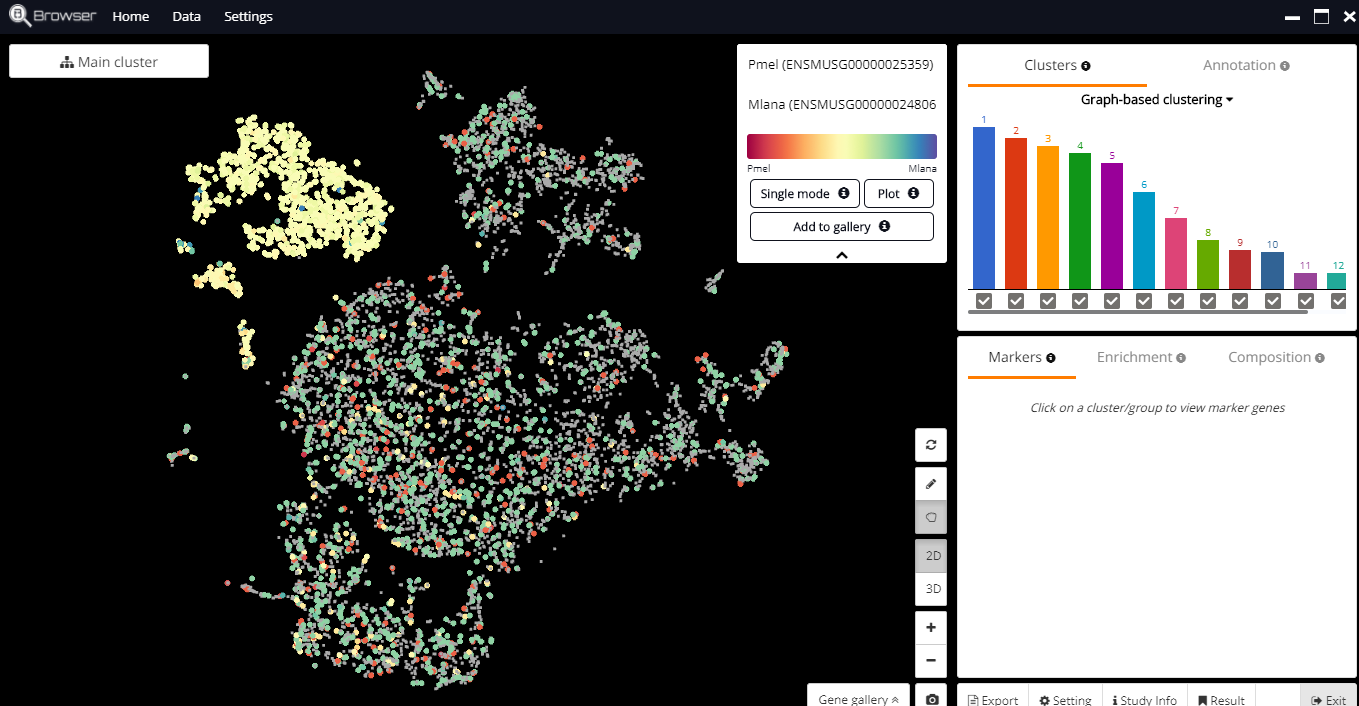
Fig.1: Yellow clusters: spiked-in tumor cells
3. Proportions of MDSCs and M2 macrophages decrease in Adar1-null
In their study, Ishizuka and colleagues noticed a decreased proportion of MDSCs (myeloid-derived suppressor cells – known for the ability to suppress T cell responses) and M2 macrophage populations (known for tumor promotion) in Adar1-null model. Let’s check this out by BBrowser within a few steps.
As there are two replicates for each condition (Adar1-null and Control), we will see four groups in the metadata: ADAR_S1, ADAR_S2, Control_S3, Control_S4. We merge ADAR_S1 and ADAR_S2 into “Adar1-null”. We merge Control_S3 and Control_S4 into Control.
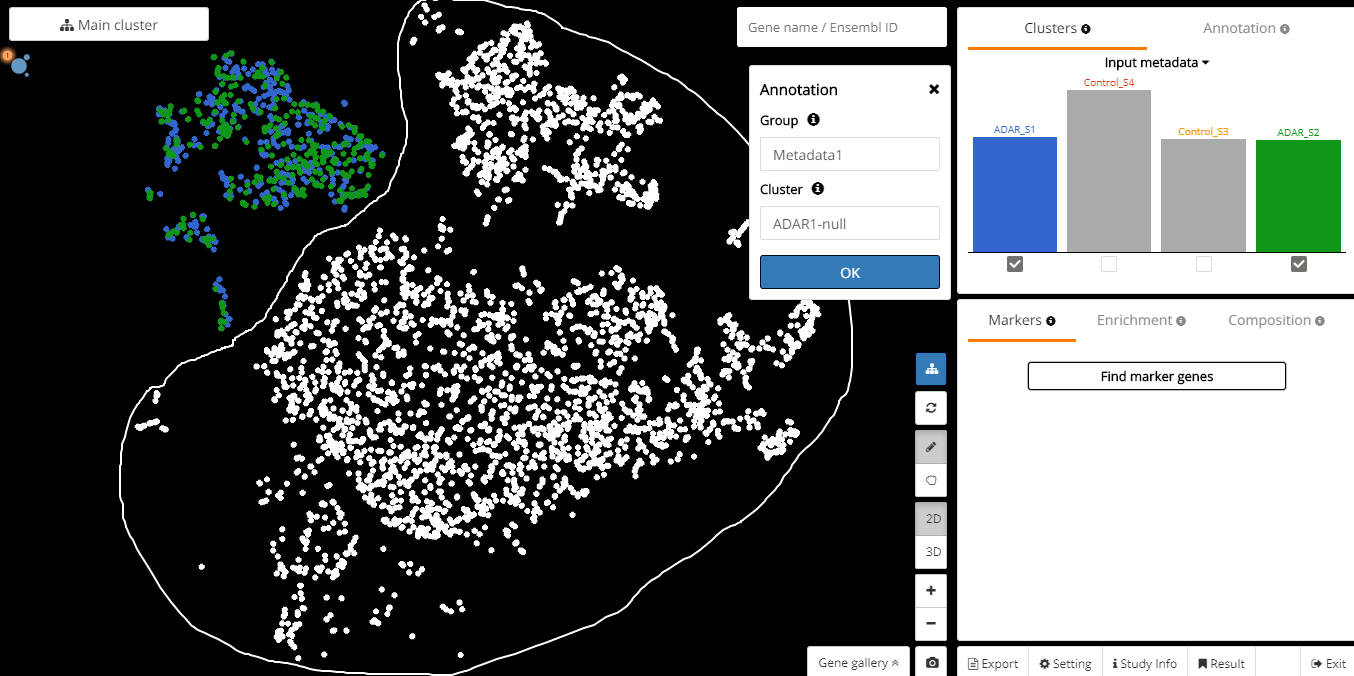
Fig. 2a: Merging ADAR_S1 and ADAR_S2 into “Adar1-null” group.
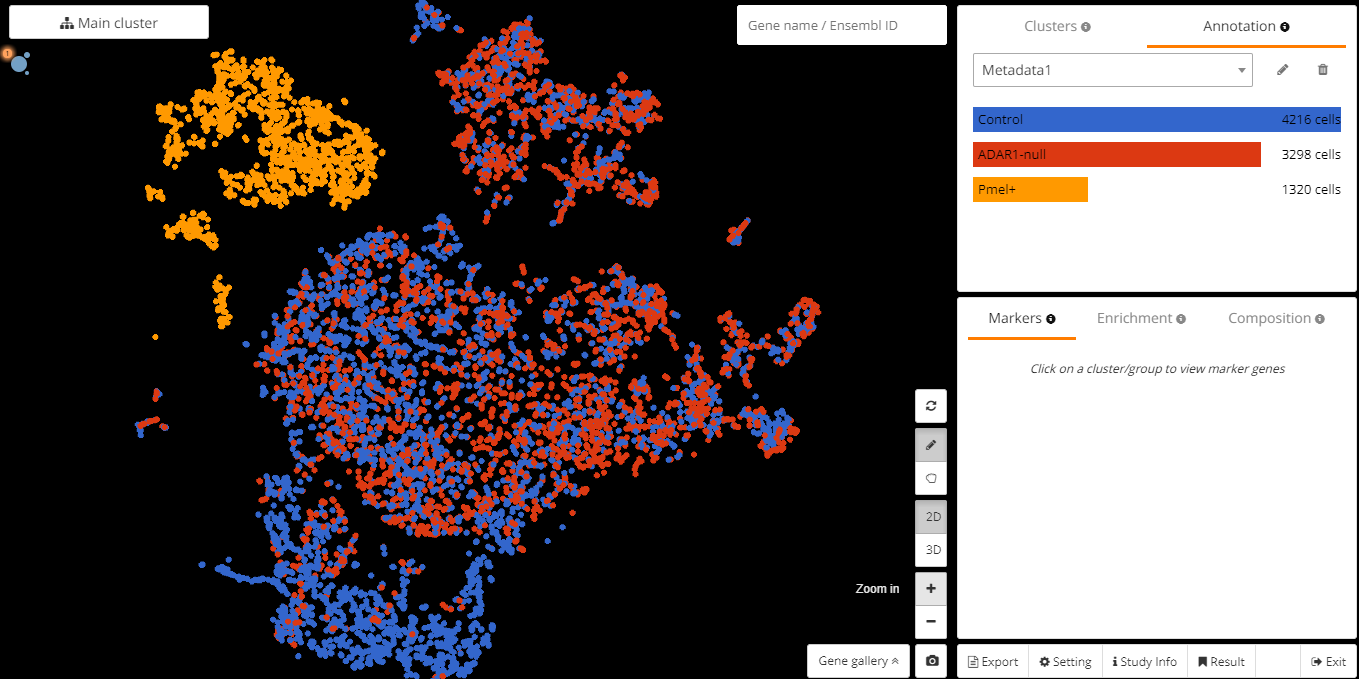
Fig. 2b: The finished plot that merged replicates into one group
After merging the metadata, we identify MDSC population using marker gene Cxcl3. We get the exact number of cells with positive expression in each group: Control (442), Adar1-null (80), and Spiked-in tumor cells (87). The remaining job is to find and compare the ratios of Cxcl3+ cells in Adar1-null and Control. This ratio in Adar1-null is 80/3298=2.4%, which is extremely low compared to the ratio in Control: 442/4216=10.4%.
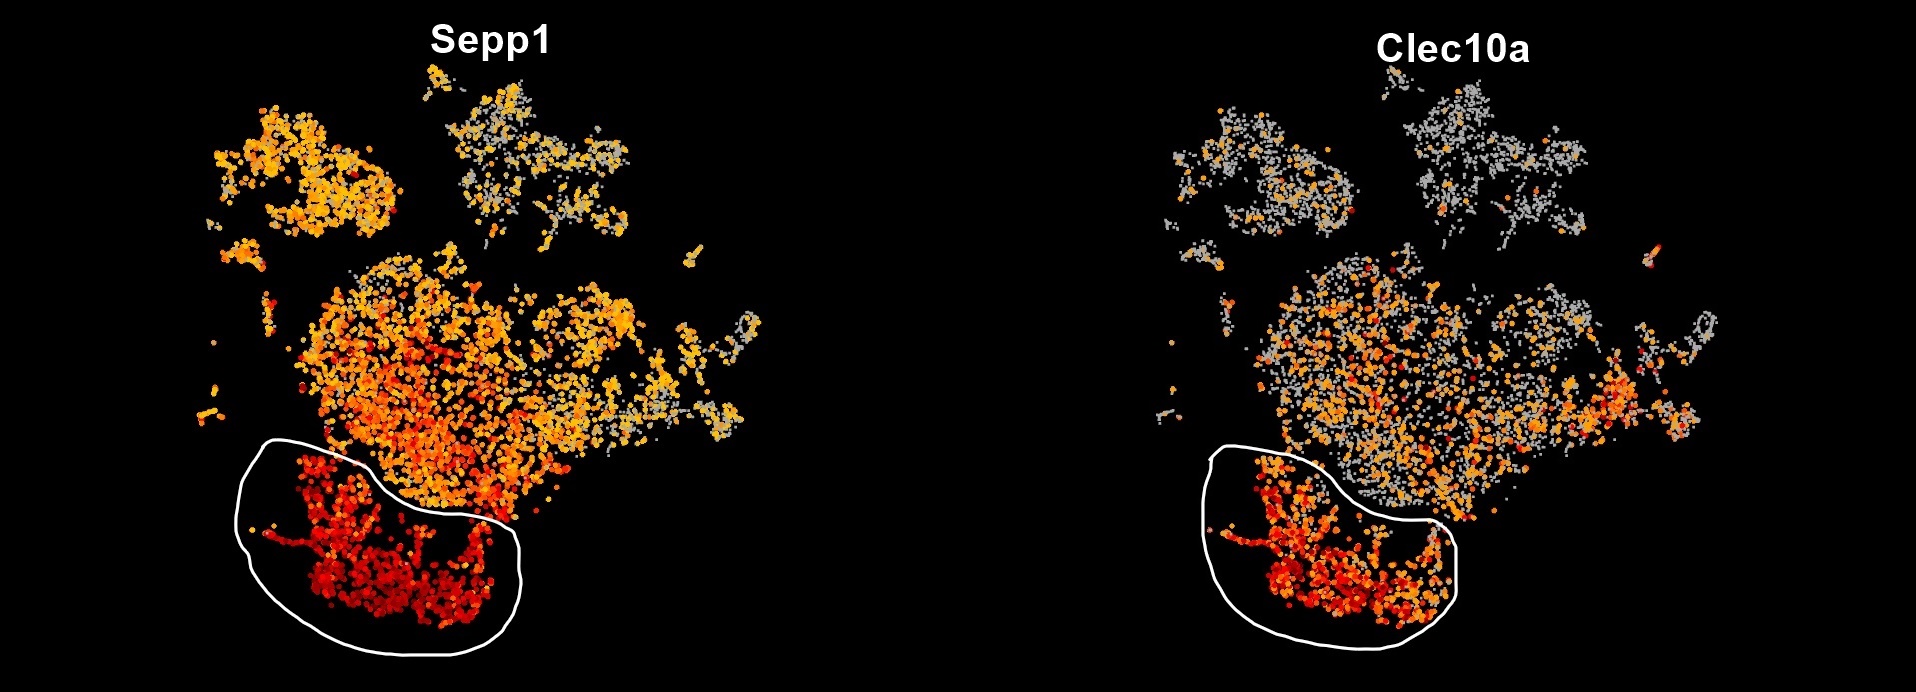
Fig. 3: M2 macrophage cluster (left: Sepp1, right: Clec10a)
We detect M2 macrophage population using Sepp1 and Clec10a as marker genes (Fig. 3). Again, we want to see the differences of M2 macrophage population in the two conditions: Adar1-null and Control. As shown in BBrowser, 86% of the cells in the M2 macrophage cluster are originated from Control mice.
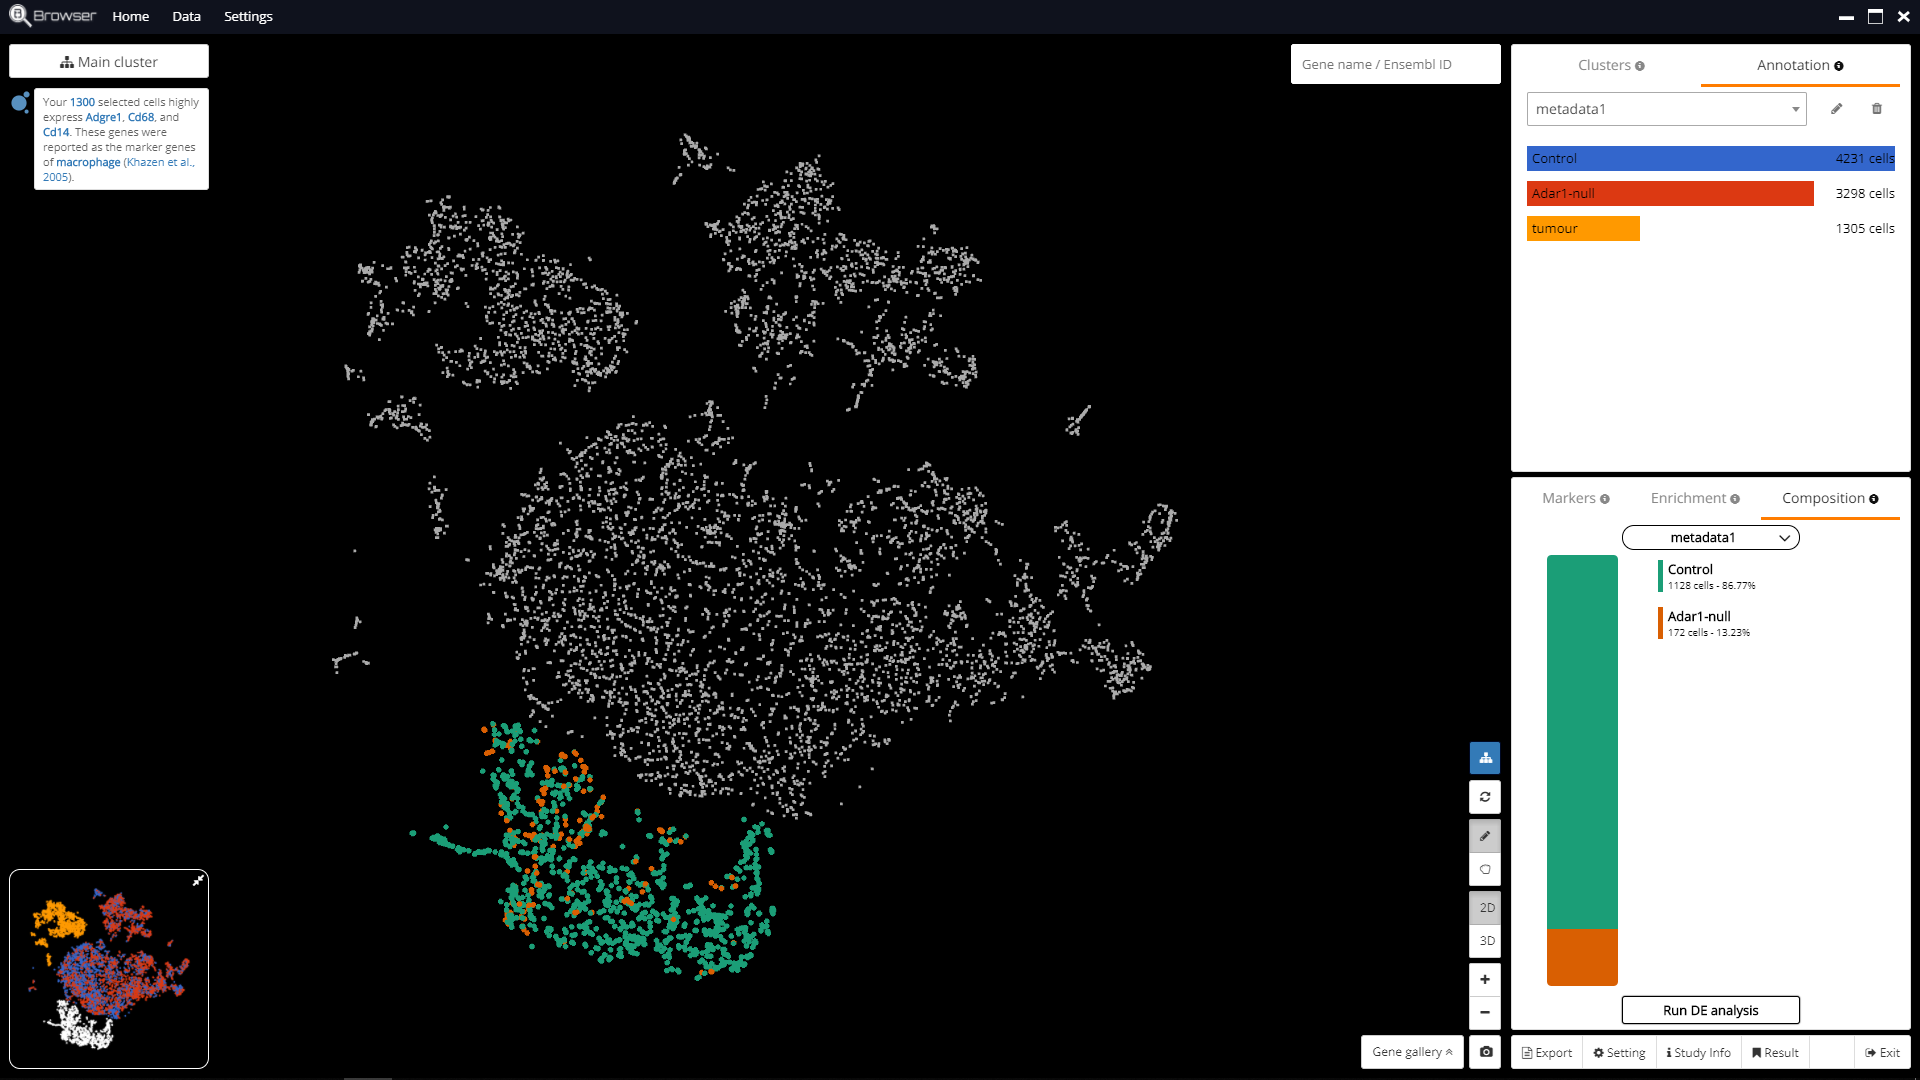
Fig. 4: M2 macrophage composition in the two conditions: Adar1-null and Control
4. Comparing Adar1-null and Control in infiltrating immune cells
“Deletion of Adar1 causes a global reshaping of the tumor immune compartment and increased abundance of IFNs.”
To produce this in BBrowser, we perform Gene Set Enrichment Analysis (GSEA) for the most up-regulated genes in Adar1-null compared with the Control model. As a result, “response to type I interferon” was identified in the top list of gene ontologies.
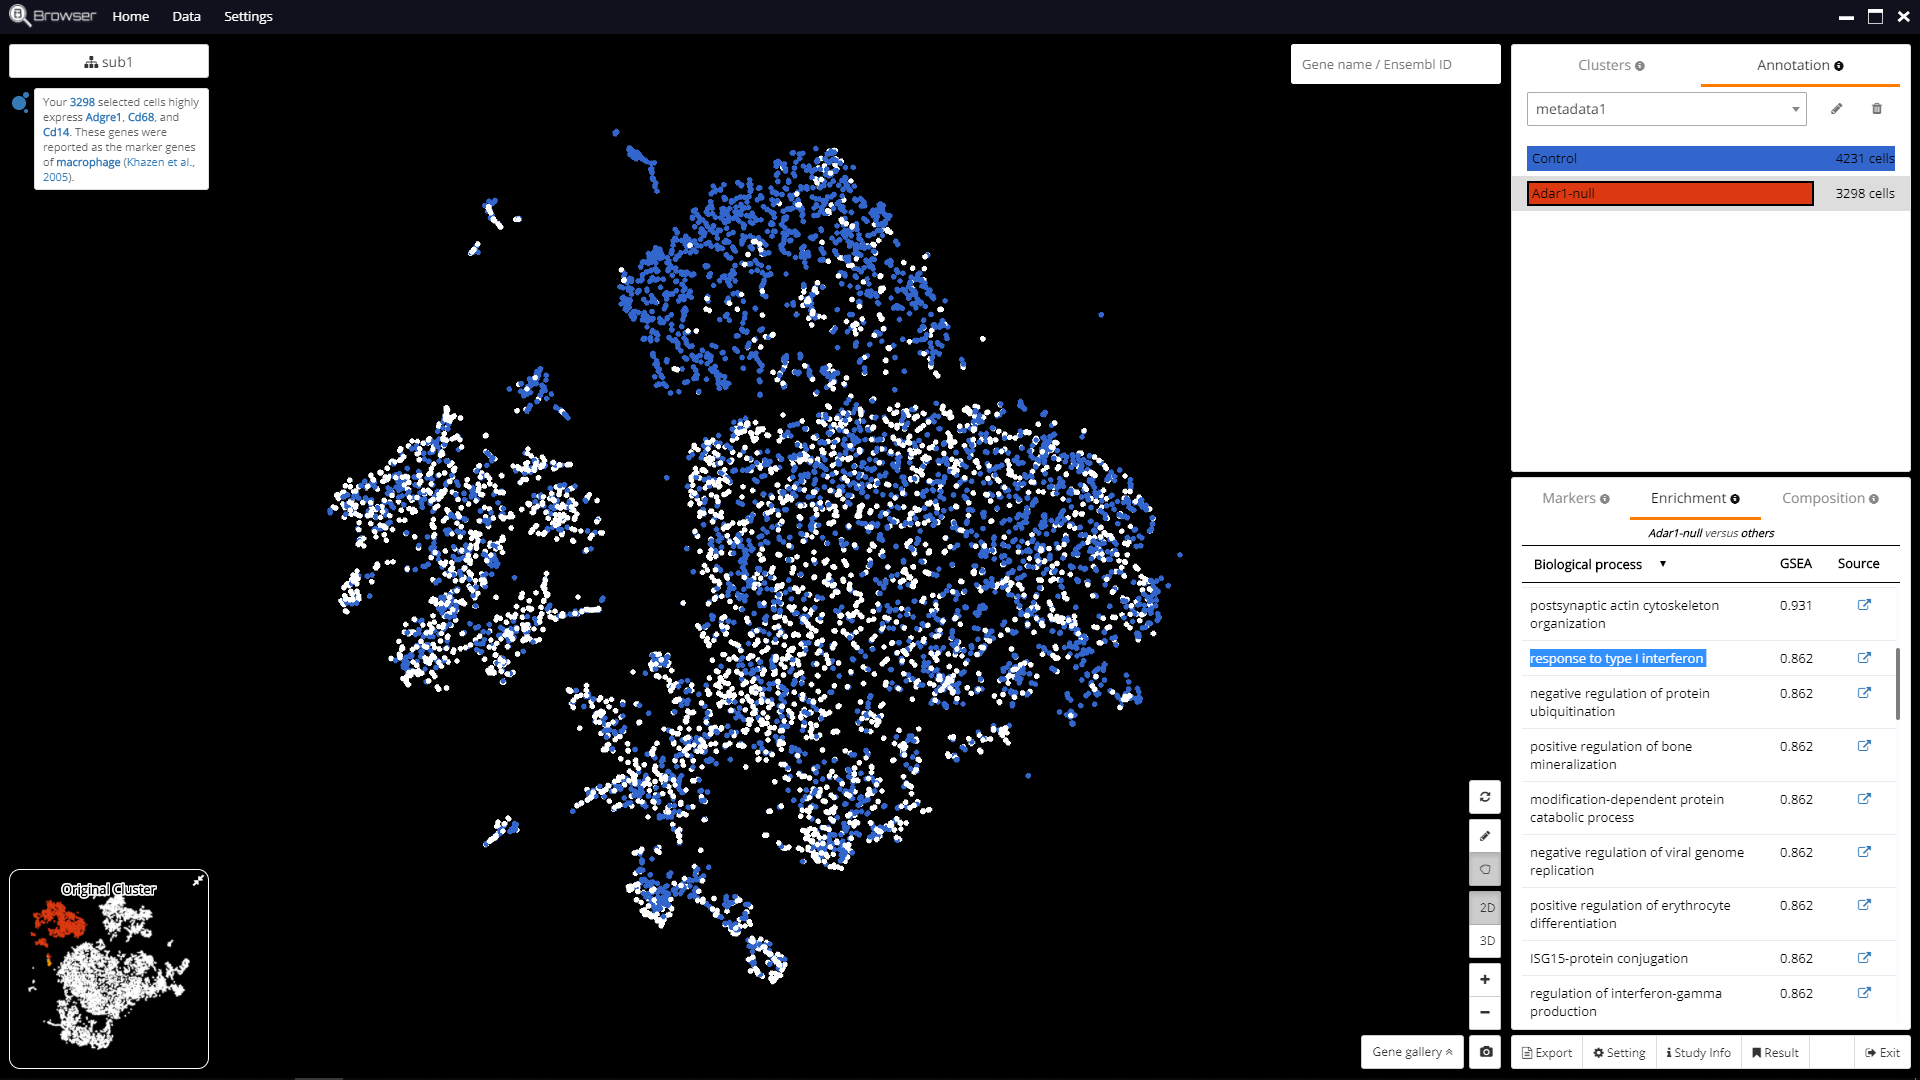
Fig. 5 Gene Set Enrichment Analysis results for up-regulated genes in Adar1-null compared with Control.
Above is our recording of how we explored this amazing work. Apart from these analyses, there are many more functions that you can perform using BBrowser (eg. sub-clustering, DE analysis, and real-time cell-type prediction), and have many flexibilities to explore this dataset in your own way. We welcome all the valuable comments on BBrowser. It is now available for download at www.bioturing.com/product/bbrowser.
Reference:
- Manguso, R. T. et al. In vivo CRISPR screening identifies Ptpn2 as a cancer immunotherapy target. Nature 547, 413–418 (2017).
- Mannion, N. M. et al. The RNA-editing enzyme ADAR1 controls innate immune responses to RNA. Cell Rep. 9, 1482–1494 (2014).
- Ishizuka, J. J. et al. Loss of ADAR1 in tumours overcomes resistance to immune checkpoint blockade. Nature 565, 43–48 (2019).
- Srivastava, M.K., Sinha, P., Clements, V.K., Rodriguez, P. & Ostrand-Rosenberg, S. Myeloid-derived suppressor cells inhibit T-cell activation by depleting cystine and cysteine. Cancer Res. 70, 68–77 (2010).
- Yuan A. et al. Opposite effects of M1 and M2 macrophage subtypes on lung cancer progression. Sci. Rep. 5, 14273 (2015)
Abbey
Thanks for the terrific guide
Mark
Great review!