Tiny as they are, retinal cells are extremely abundant and complex. The total population of about 100 million rod photoreceptors is among the most numerous neuron populations in the human body, second to cerebellar granule cells (Masland et al., 2012). Forming a sheet of tissue that is only ~200 μm thick, the retina hosts a super complex neural network that carries out feats of image processing. In 2012, Masland and colleagues revealed how more than 60 distinct neuronal cell types are organized in the mouse retina. Although much research has enriched our understanding of this complex neuronal system, questions remain regarding how retinogenesis happens and which factors regulate the differentiation from neural progenitors to such diverse neuronal cell types in the mammalian retina.
This is not clearly understood, until a couple of days ago when Clark and colleagues at Johns Hopkins published their work “Single-Cell RNA-Seq Analysis of Retinal Development Identifies NFI Factors as Regulating Mitotic Exit and Late-Born Cell Specification”. Using single-cell RNA sequencing to map an atlas of retinal cells along the developmental stages, the study shed light on how retinal neurogenesis initiates at detailed transcriptomic resolution, thus receiving so much interest from the scientific community.
Seeing it as a valuable resource to support further discoveries, we made the dataset available in BioTuring Single-cell Browser – the aim is to enable easy access and reanalysis of the study. Here we are excited to share with you how we reproduced some of the analyses in the study and interesting insights we discovered alongside, featuring a hybrid population expressing rod and cone markers.
1. How it is designed
Aiming to profile the dynamics of retinal cells during retinal development, Clark and colleagues profiled 120,804 single cells in total from whole retinas at 10 developmental time points, from E11 (prior to the onset of neurogenesis) to P14, using the 10x Genomics Chromium 30 v2 platform.
2. Identify retinal cell types using BioTuring Browser
Let’s take a first look at the cellular heterogeneity. We were able to identify major cell types in the retina, which highly matched Clark and colleagues’ findings. Those include retinal progenitor cells (RPCs), neurogenic cells, ganglion cells, amacrine cells, photoreceptor precursors, bipolar cells, muller glia, and horizontal cells.
First, we used automatic cell type prediction to quickly identify some major cell types in the data. We defined a knowledge base of marker genes for each cell type in the retina, and circle the clusters one by one to get the rough prediction. This allowed us to recognize photoreceptor precursor cells, rods, amacrine cells, and muller glia.
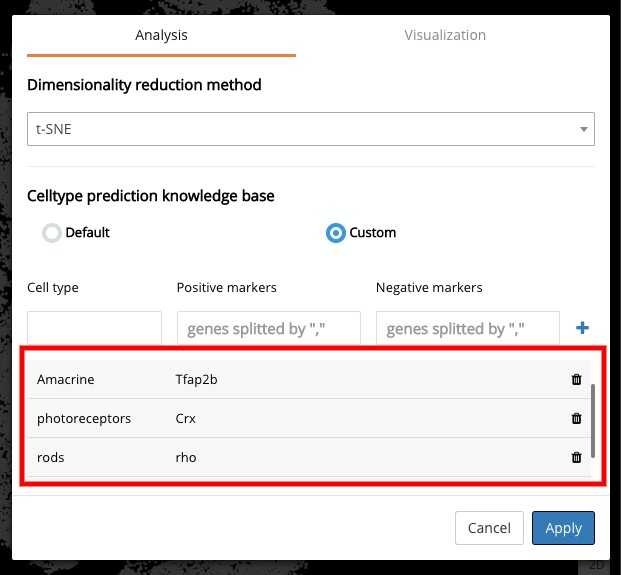
Setting up the knowledge base for retinal cell type prediction in BioTuring Browser, including the cell types and their associated marker genes
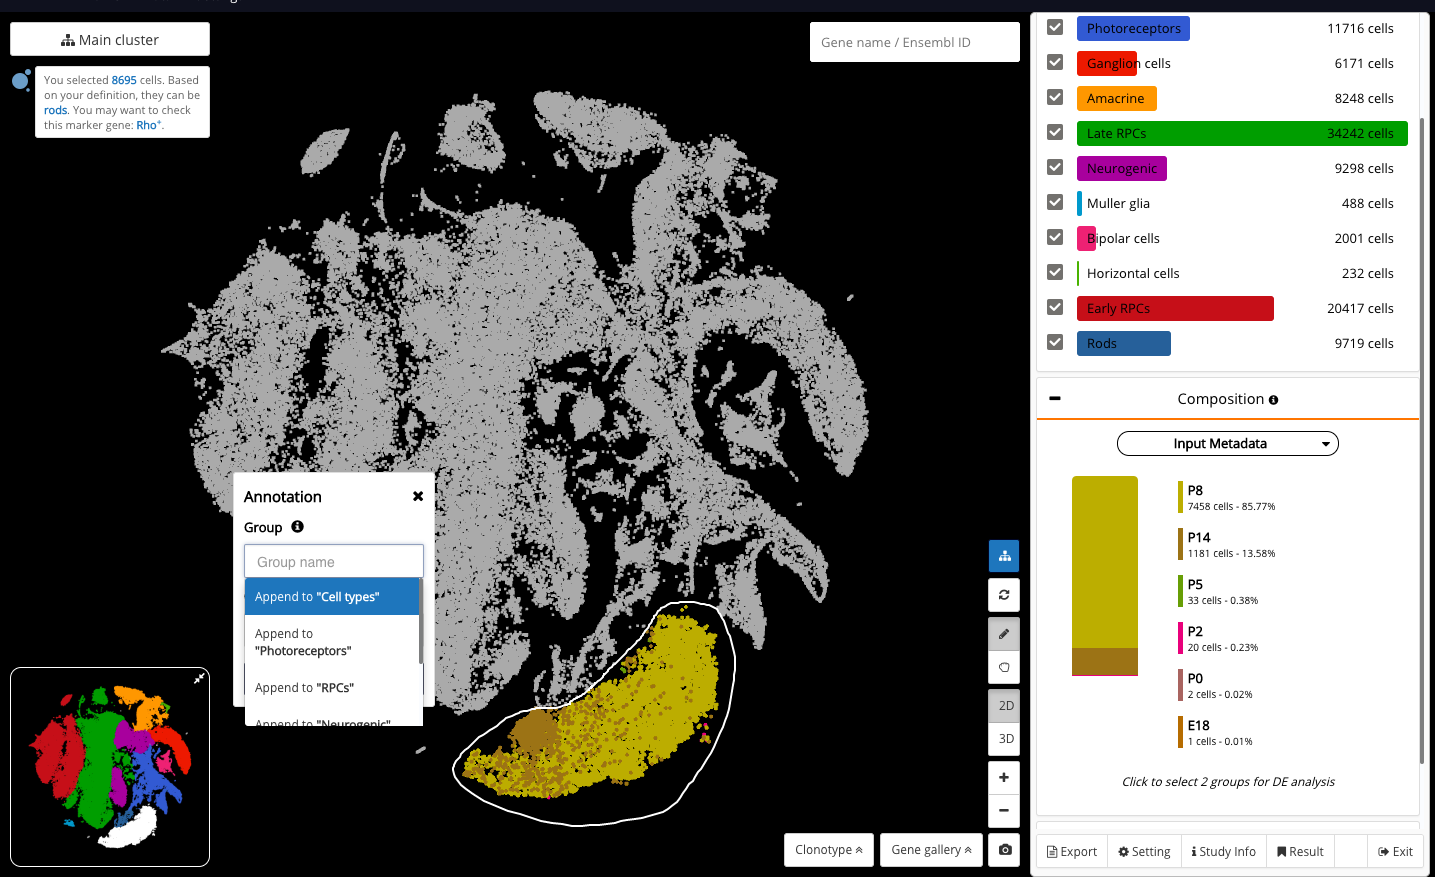

Circling a cluster and getting the cell type prediction result
Other cell types were detected with marker gene detection, or by querying the known marker genes’ expression.
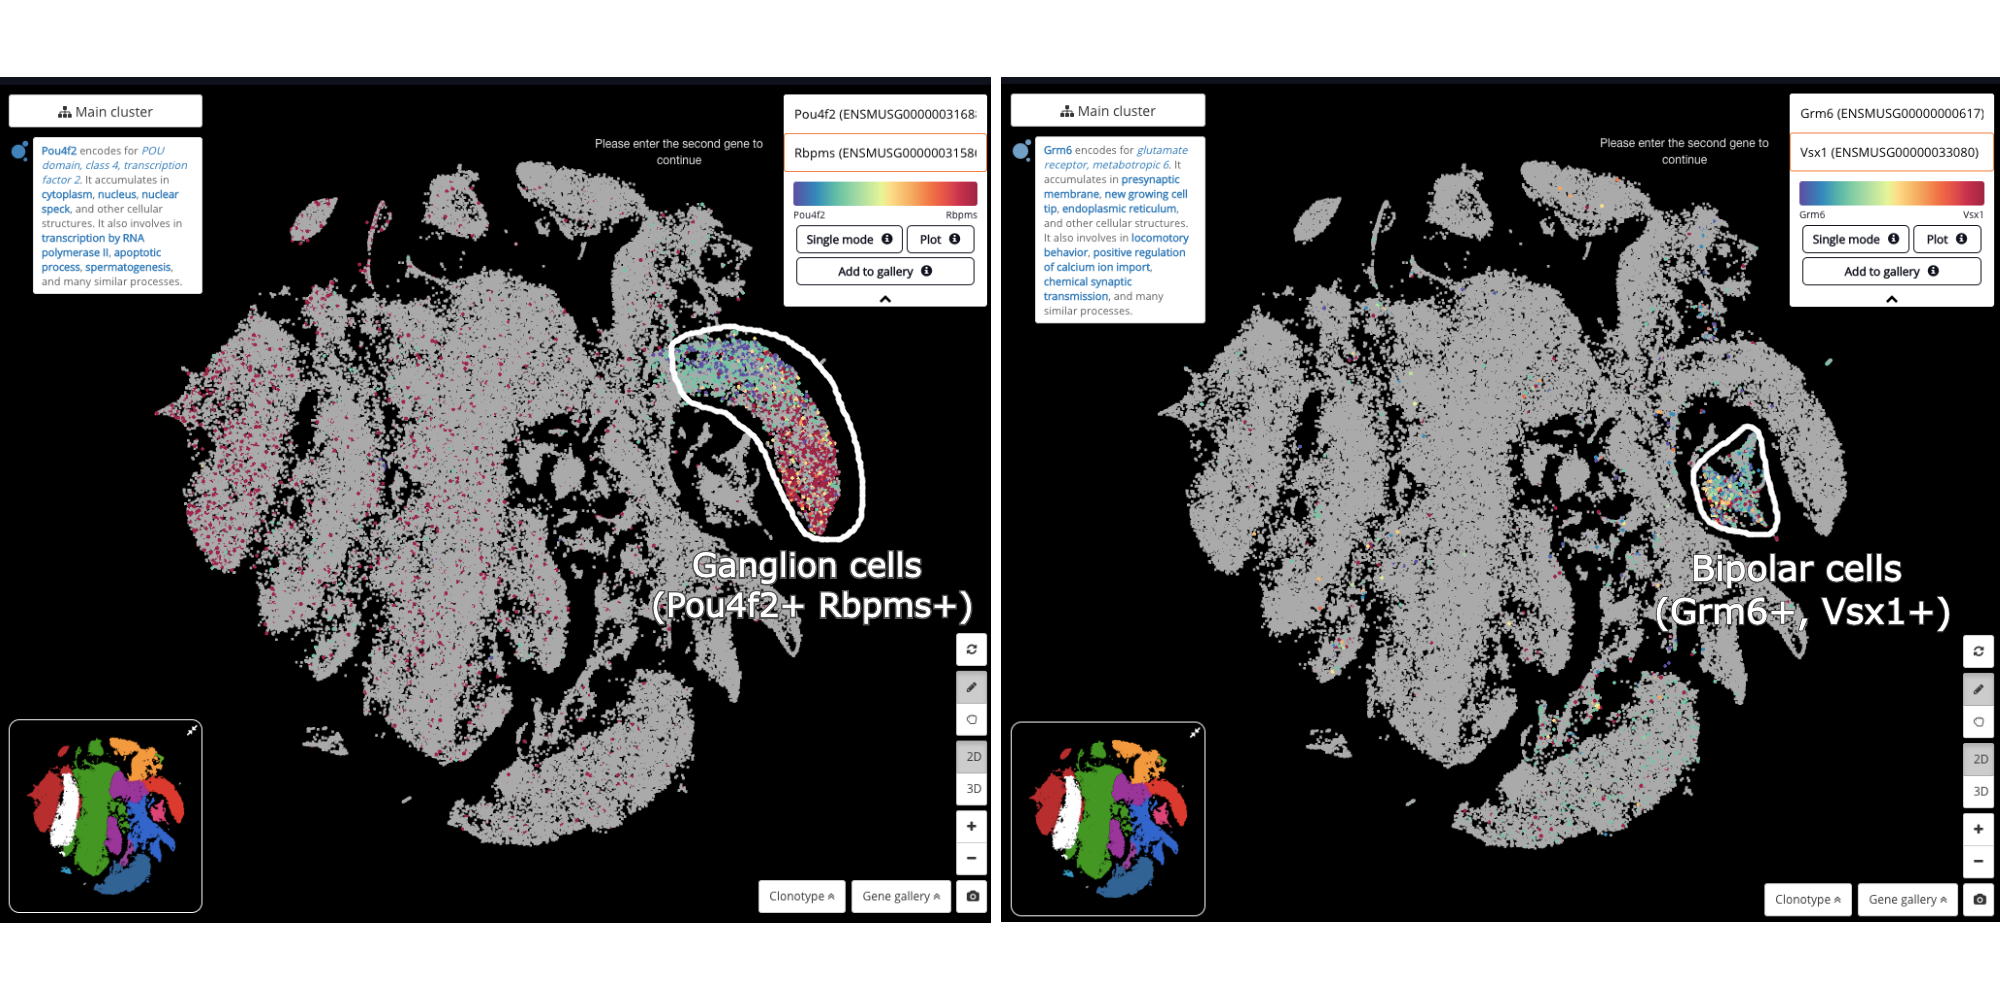
Detecting ganglion cells (Pou4f2+, Rbpms+) (left) and bipolar cells (Grm6+, Vsx1+) (right)
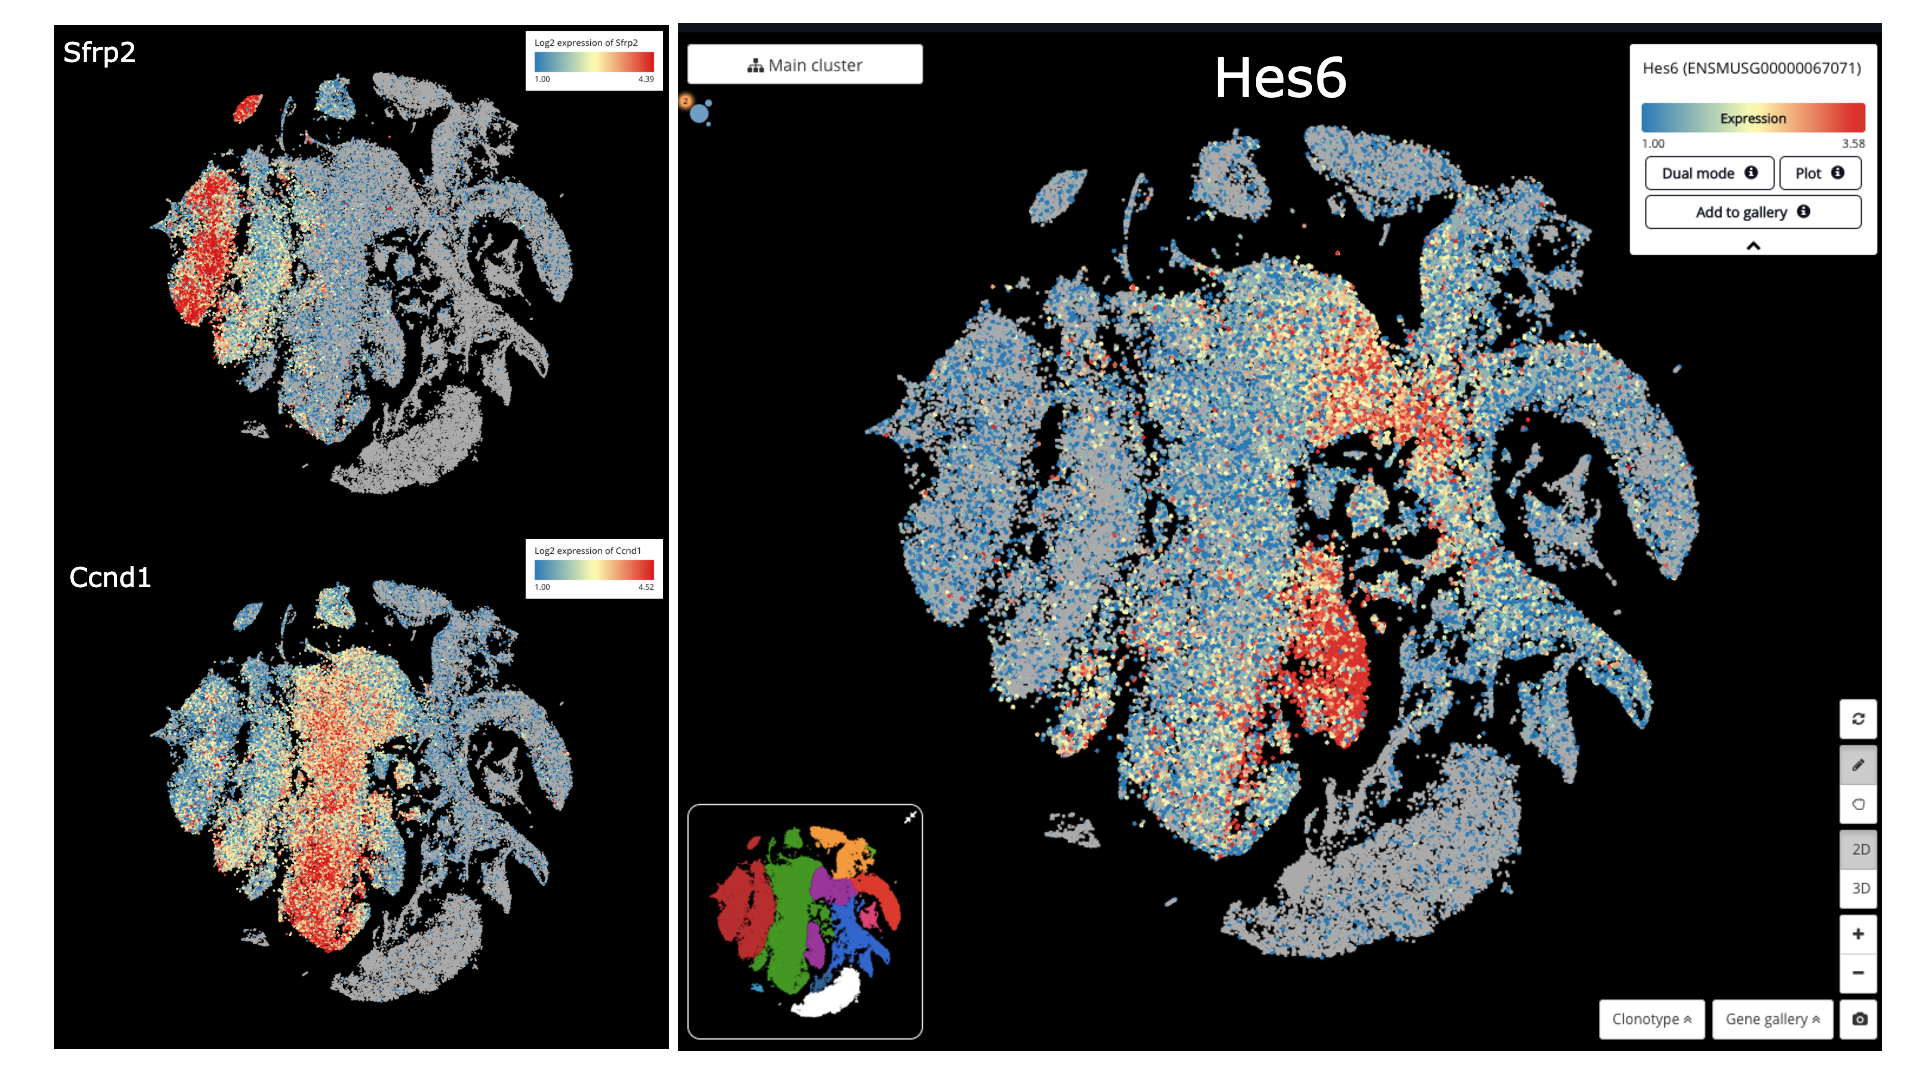
Detecting early RPCs (Sfrp2+), late RPCs (Ccnd1+) and neurogenic population (Hes6+)
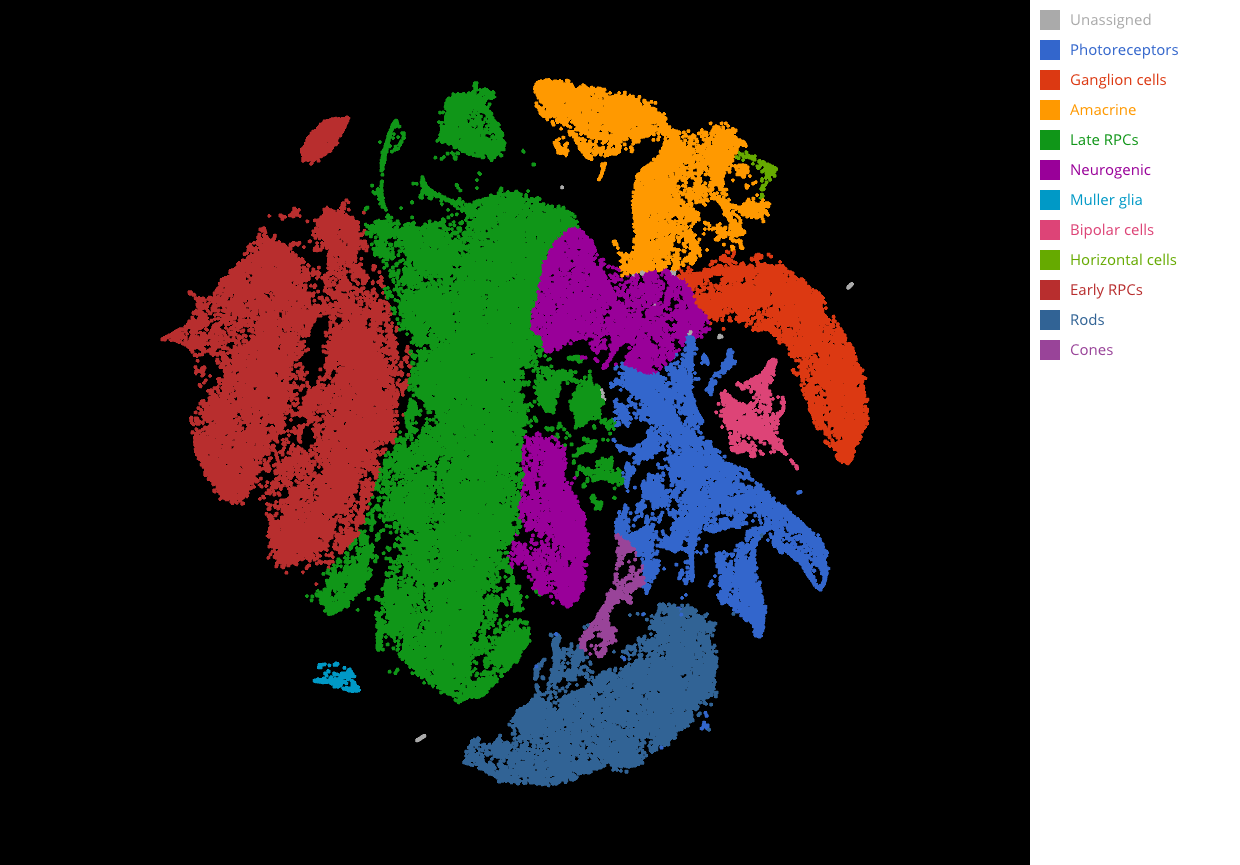
Complete cell type identification
3. Trace cell lineages with a UMAP
In order to understand the full course of retinal neurogenesis, we constructed a UMAP of this dataset, and closely studied how cell types are located along the cell lineages. We captured a smooth transition from early RPCs to late RPCs, to neurogenic populations, and drastic differentiation into multiple cell types, including ganglion cells, amacrine cells, and photoreceptor precursors.
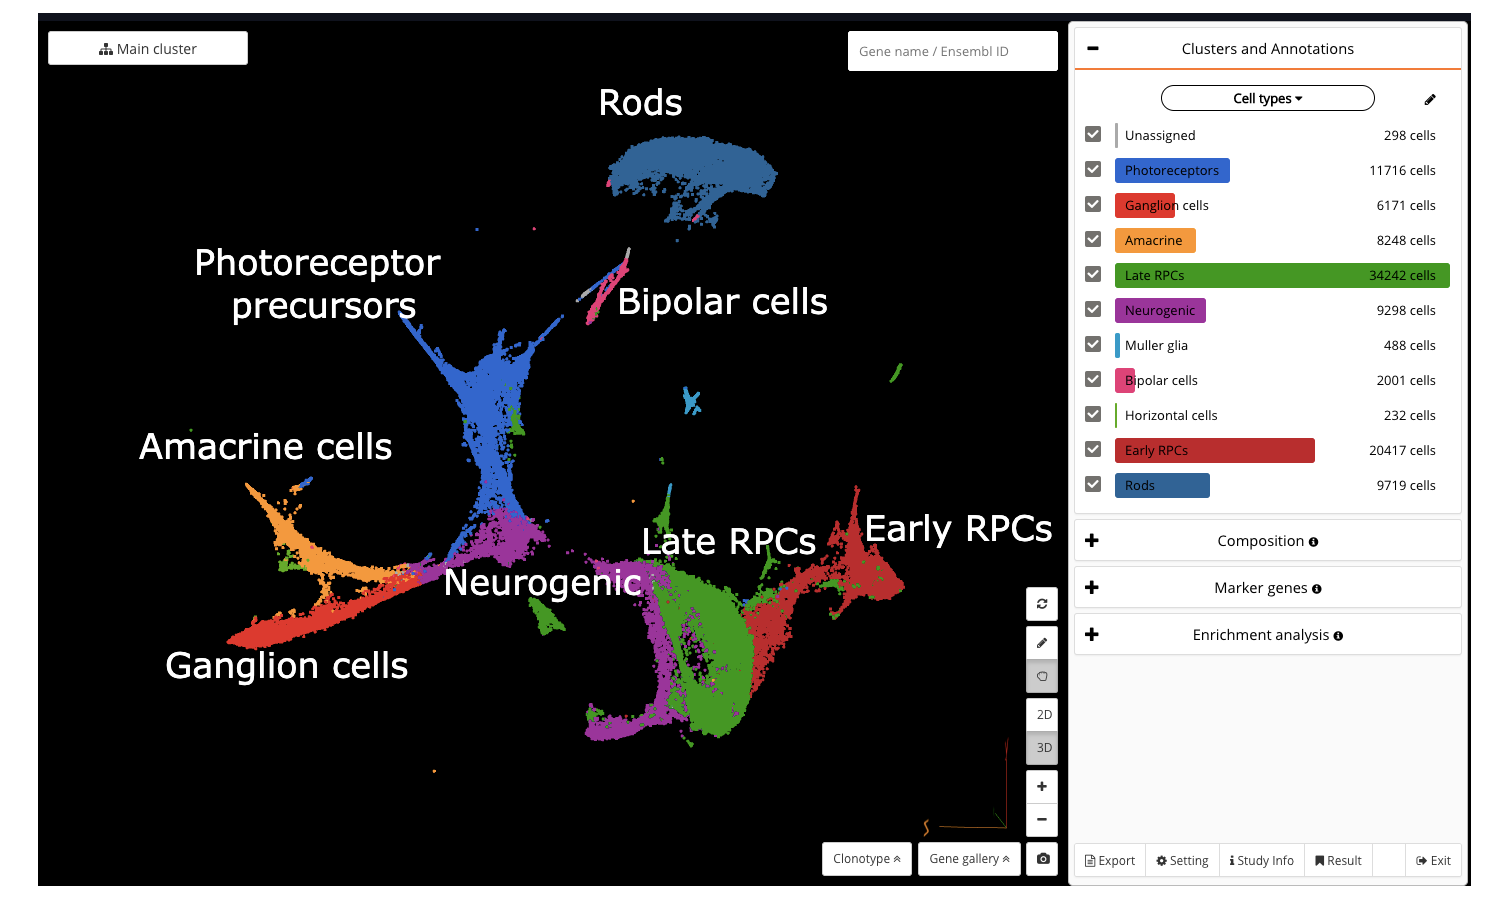
Constructing a UMAP
4. Examine compositional changes across retinal development
To clearly estimate when each cell type is formed, we conducted a comparison of cell type composition among all the investigated time points.
Much of the differentiation was triggered at E14, when we started to see a considerable proportion of neurogenic and retinal ganglion cells, and a small percentage of amacrine cells. At E18, photoreceptor precursors appeared, which continuingly became larger in proportion at later stages, and dominated at P5. They started to differentiate into rods at P8.
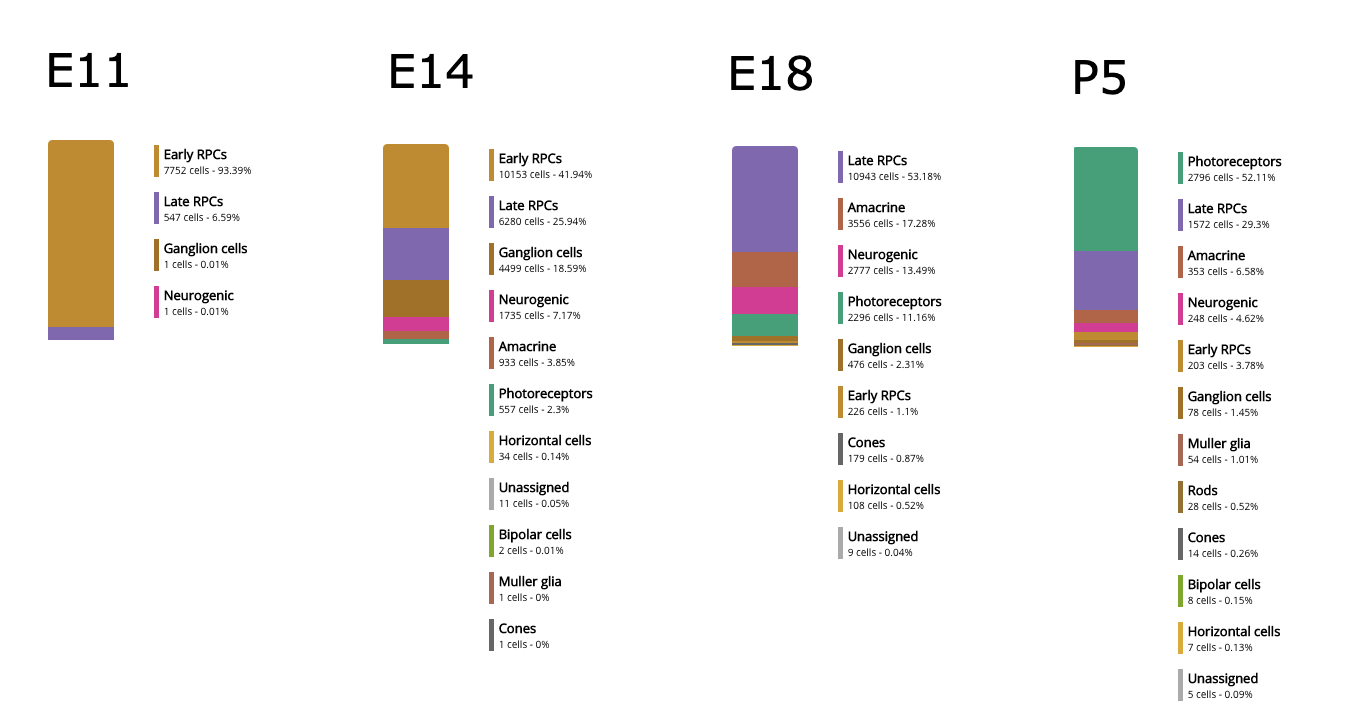
Comparing retinal cell type composition among different ages
5. Beyond the study: interesting hybrid form during photoreceptor differentiation
Interesting stories came along when we further examined the genesis of photoreceptor populations – rods and cones. Showing rod marker (Nr2e3) and S-opsin cone marker (Opn1sw)’s expression across all the cells, we noticed a hybrid population (more than 200 cells) that expressed both markers, existing at P8 and P14, seemingly standing between cones and rods on the lineage. This hints a potential transition from the cone into the rod fate during photoreceptor development.
We then performed sub-clustering on just the photoreceptors (Crx+) to filter out other cell types and just focus on this population. Here we were able to see the transition in higher resolution. Interestingly, this hybrid form also existed in the adult mouse retina dataset (P14) from Macosko 2015. However, it might not compose strong evidence because Nr2e3 is also expressed across other clusters.
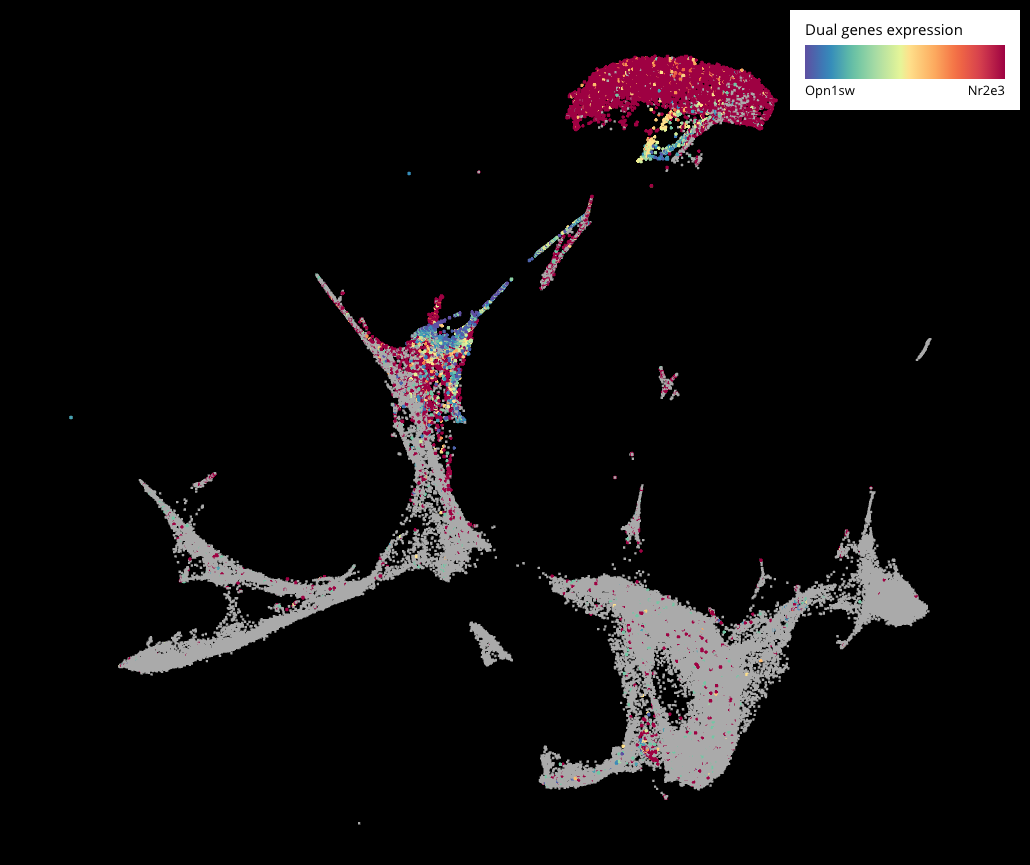
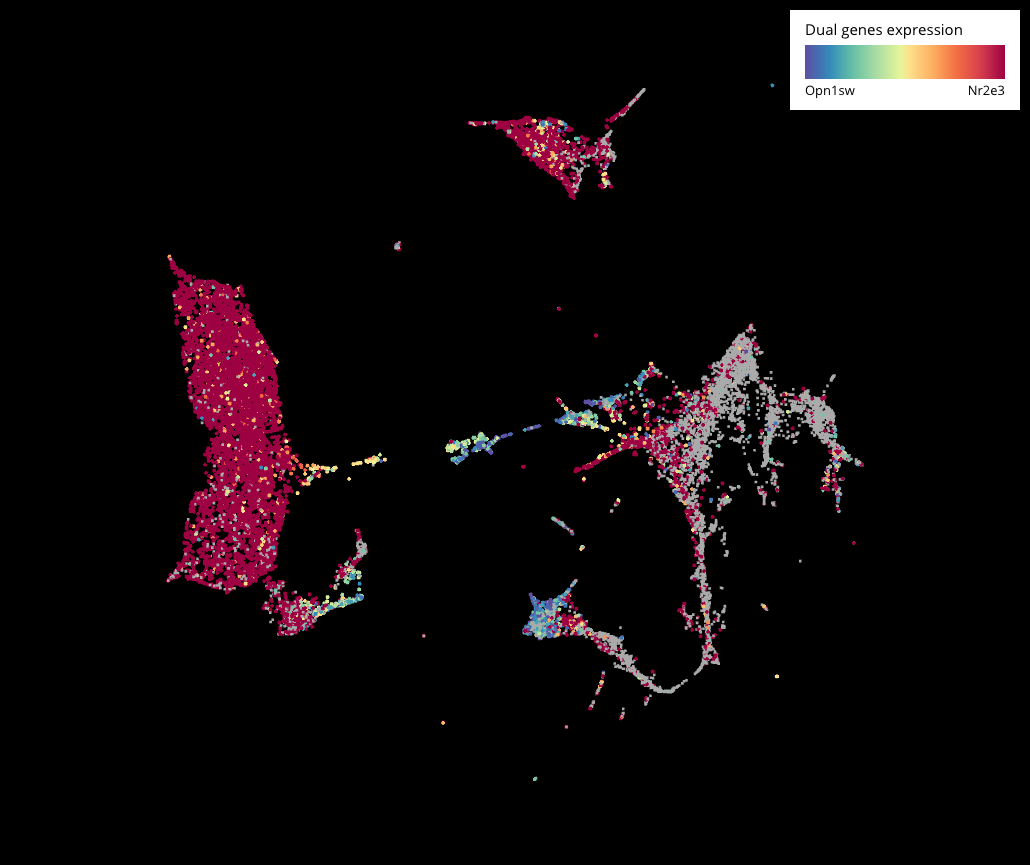
Expression of Opn1sw (S-cone marker) and Nr2e3 (rod marker) across the whole dataset (top) and the sub-clustering of photoreceptor population (bottom). Cells that express both genes are colored in yellow.
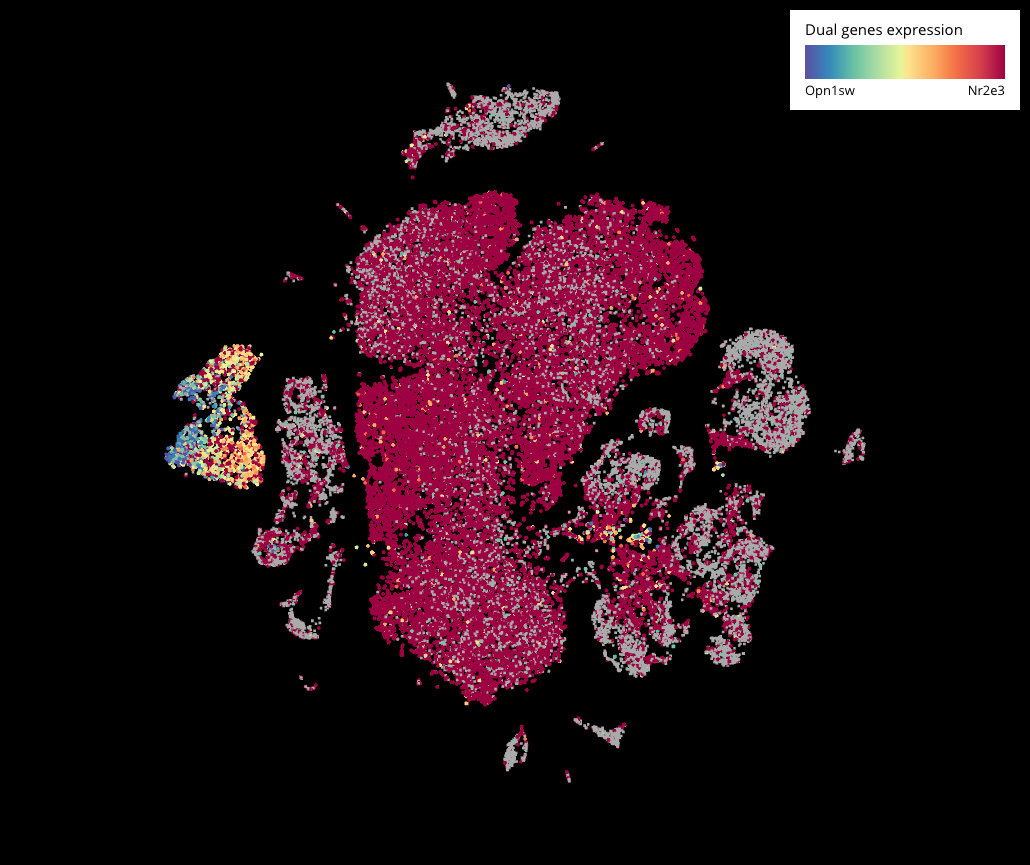
Expression of Opn1sw and Nr2e3 in the dataset of Macosko and colleagues (2015). Cells that express both genes are colored in yellow.
Recalling the “transcriptional dominance” model…
We conducted more research into this hybrid form and traced back to the “transcriptional dominance” model of photoreceptor cell fate determination, once coined by Swaroop and colleagues back in 2010. The model hypothesizes that photoreceptor precursor cells follow a default pathway to differentiate into S cones unless additional regulatory signals direct the precursor to acquire a rod or M cone identity. More specifically, induction of neural retina leucine zipper protein (NRL) and its target, photoreceptor-specific nuclear receptor (NR2E3), suppresses cone genes and commits the cells to the rod fate. Without NRL and NR2E3, photoreceptor precursors will follow the ‘default’ pathway to S cones unless TRβ2 and its ligand triiodothyronine (T3) induce M opsin and suppress S opsin expression to form M cones.
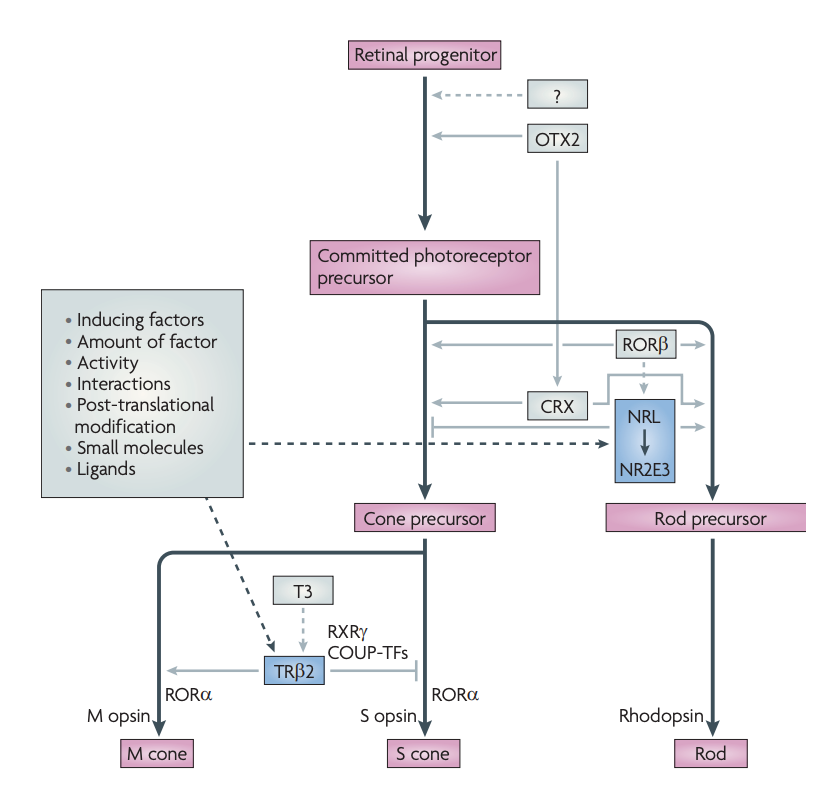
Transcriptional dominance model of photoreceptor cell fate determination (Swaroop, 2010)
Therefore, the hybrid form detected in Clark and colleagues’ dataset could potentially be the population with rod cell fate, in which Nr2e3 is on its way to suppress cone marker Opn1sw. Although this is not sufficient to conclude, we hope this observation can open up further research into this hybrid form and photoreceptor cell fate decision as a whole.
Above is a brief summary of how we explored this valuable single-cell dataset using BioTuring Single Cell Browser. We also captured our reanalysis in the following video.
We welcome you to follow the steps to explore the datasets, and flexibly use other analyses available in the Browser, such as differential expression analysis and sub-clustering, to further explore the work. BioTuring Browser is freely available for download at www.bioturing.com/product/bbrowser.
References:
Clark, Brian S., et al. "Single-Cell RNA-Seq Analysis of Retinal Development Identifies NFI Factors as Regulating Mitotic Exit and Late-Born Cell Specification." Neuron (2019).
Macosko, Evan Z., et al. "Highly parallel genome-wide expression profiling of individual cells using nanoliter droplets." Cell 161.5 (2015): 1202-1214.
Masland, Richard H. "The neuronal organization of the retina." Neuron 76.2 (2012): 266-280.
Swaroop, Anand, Douglas Kim, and Douglas Forrest. "Transcriptional regulation of photoreceptor development and homeostasis in the mammalian retina." Nature Reviews Neuroscience 11.8 (2010): 563.
Be the first to get notified when a new single-cell dataset is reanalyzed