In single-cell data analysis, it is critical to understand how gene expression varies among different cell types, tissue compartments, conditions, or different patients. Although many tools and methods have been developed to support single-cell differential expression analysis, they all require some basic coding skills.
In this blog, we show you 4 simple steps to quickly perform single-cell differential expression analysis using BioTuring Single-cell Browser without any coding involved. For illustration, we will reproduce the differential expression results in the paper “A unique microglia type associated with restricting the development of Alzheimer’s disease”, by Keren-Shaul and colleagues from Amit Lab. This study discovered a novel disease-associated microglia population (DAM) highly expressing lipid metabolism and phagocytic genes.
Reproducing the differential expression analysis between the DAM and homeostatic microglia in Keren-Shaul et al. (2017) using BioTuring Browser
1. Experimental Design
Aiming to map the immune populations in Alzheimer’s disease (AD) and wild-type mice (WT), this study performed massive single-cell RNA sequencing on immune cells from the brains of AD-transgenic mice at 1,3,6, and 8 months and WT controls. Among major immune cell types recognized was a novel microglia (DAM) population specific to AD, with distinct transcriptomic profiles and pathways. Differential expression (DE) analysis on the population showed an upregulation in Ctsd, Tyrobp, Trem2, as well as lipid metabolism and phagocytic genes such as Apolipoprotein E (Apoe), lipoprotein lipase (Lpl), and Cystatin F (Cst7) (Fig 1).
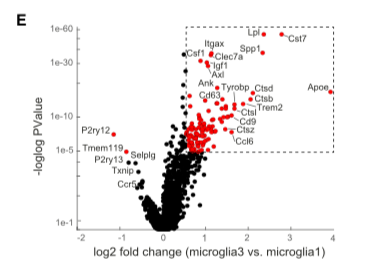
Fig 1. Differentially expressed genes between DAM and homeostatic microglia (Source: Keren-Shaul et al., 2017)
2. Finding differentially expressed genes between DAM and homeostatic microglia using BioTuring Browser
Step 1: Identify the microglia
To start off, we identify immune cell types in the data set, especially the microglia population. By querying known marker genes’ expression, we detect all the cell types mentioned in the study, including microglia (Cx3cr1), perivascular macrophages (Mrc1), B cells (Ms4a1), T/NK cells (Cd3d, Nkg7), and granulocytes (S100a9, S100a8) (See Fig 2, 3).
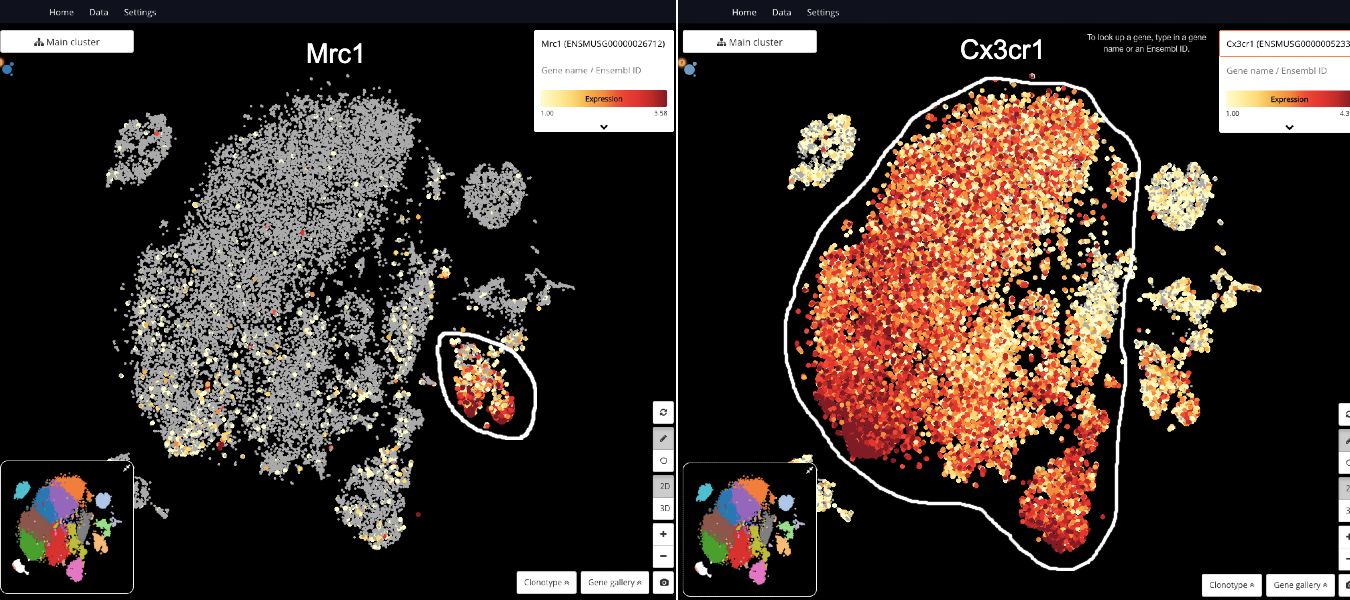
Fig 2. Detecting perivascular macrophages (Mrc1) and microglia (Cx3cr1)
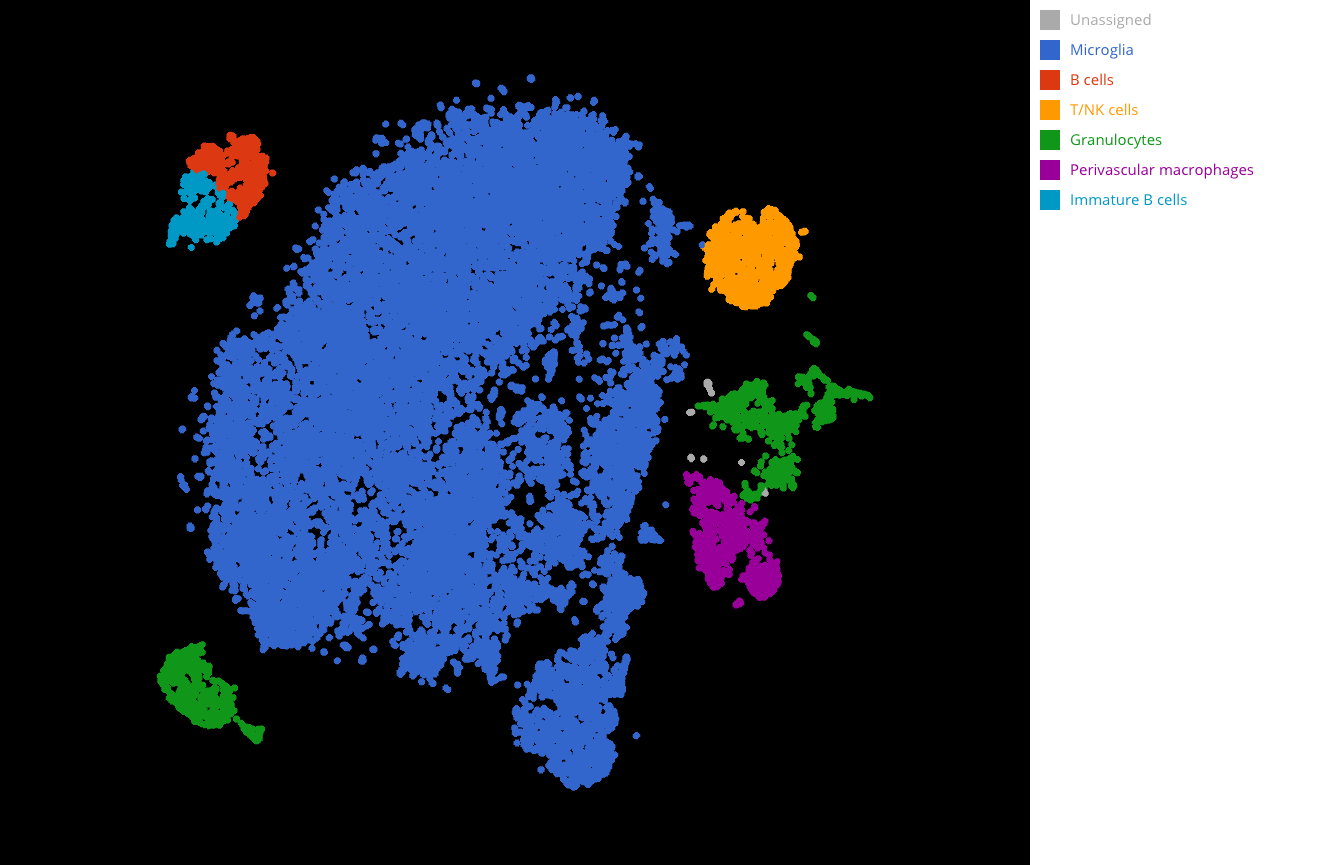
Fig 3. Full cell type annotation. Microglia are colored in blue.
Step 2: Detect the DAM
At this step, we aim to color the microglia population by AD and WT in order to find the overlapping and non-overlapping regions, thus identifying the AD-specific cluster. Therefore, we gather all the available batches of AD in the data (eg.: AD3m mouse 1, AD6m mouse1, AD6m mouse2, etc.) and annotate them as “AD” under the group “Conditions” (Fig. 4), and similarly for WT.
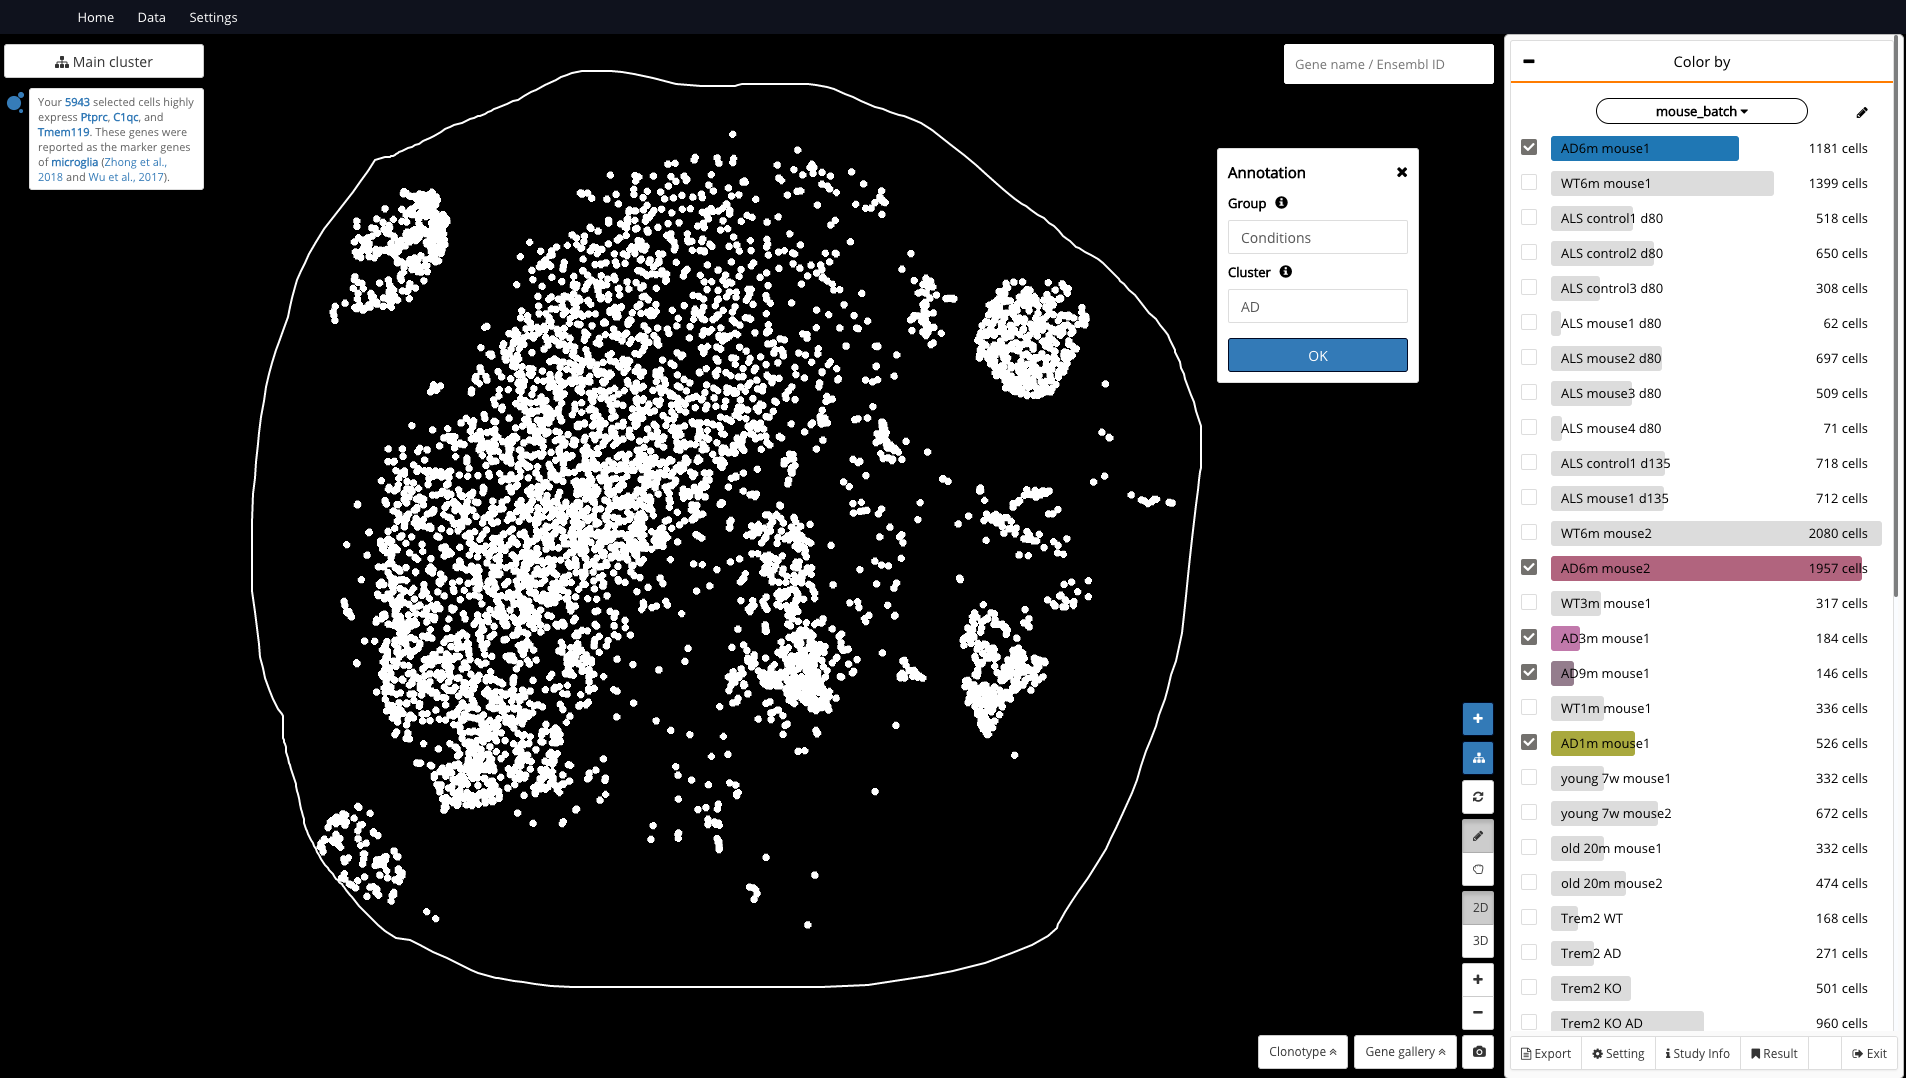
Fig 4. Grouping all AD samples and annotate them as “AD”
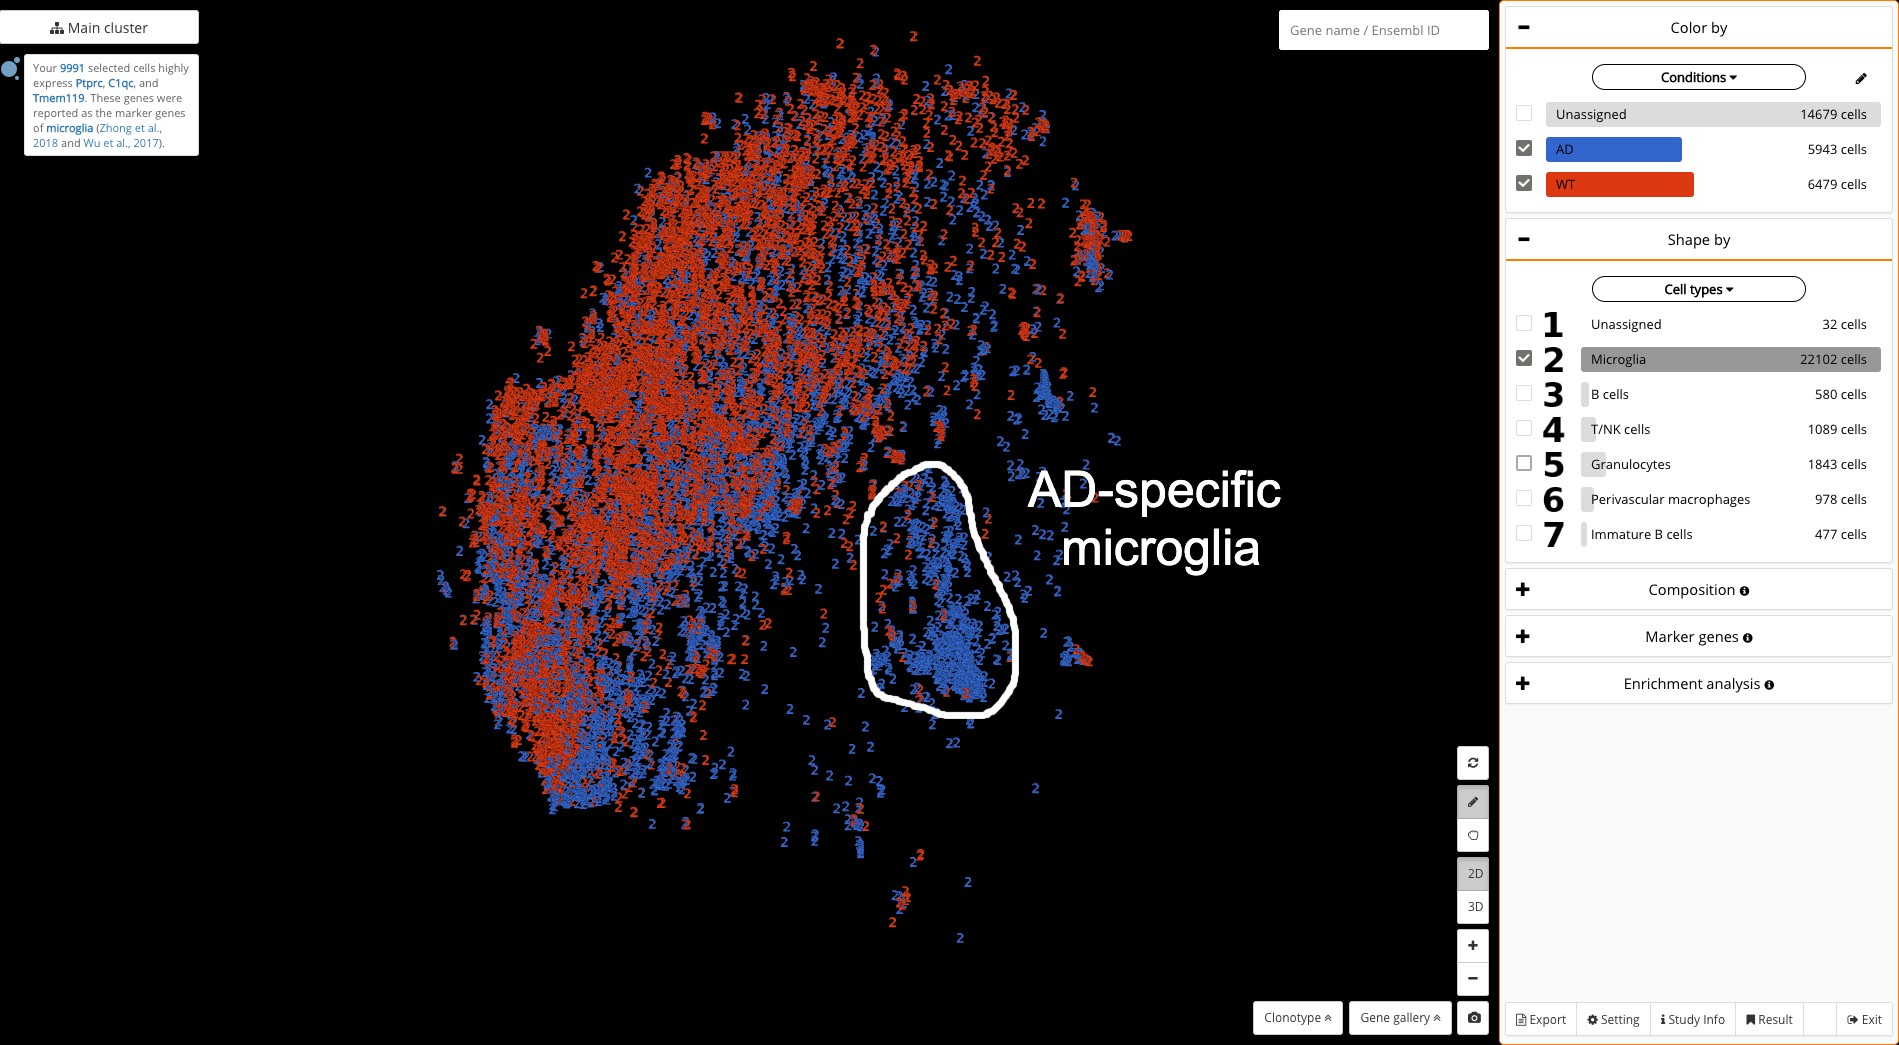 Fig 5. AD (blue) and WT (red) microglia. The DAM population is located on the right.
We then choose “Conditions” as the coloring factor and “Cell types” as the shaping factor, where we opt to view the microglia only. This allows us to easily detect a special AD-specific cluster of microglia (all blue), located on the right, quite distantly from the remaining cells (See Fig. 5).
Step 3: Annotate the DAM and homeostatic microglia under one annotation group
A critical preparation step for DE analysis in BioTuring Browser is to annotate both populations of interest under one annotation group. In this example, we circle and annotate the DAM and the homeostatic population under the same group called “Differential expression”.
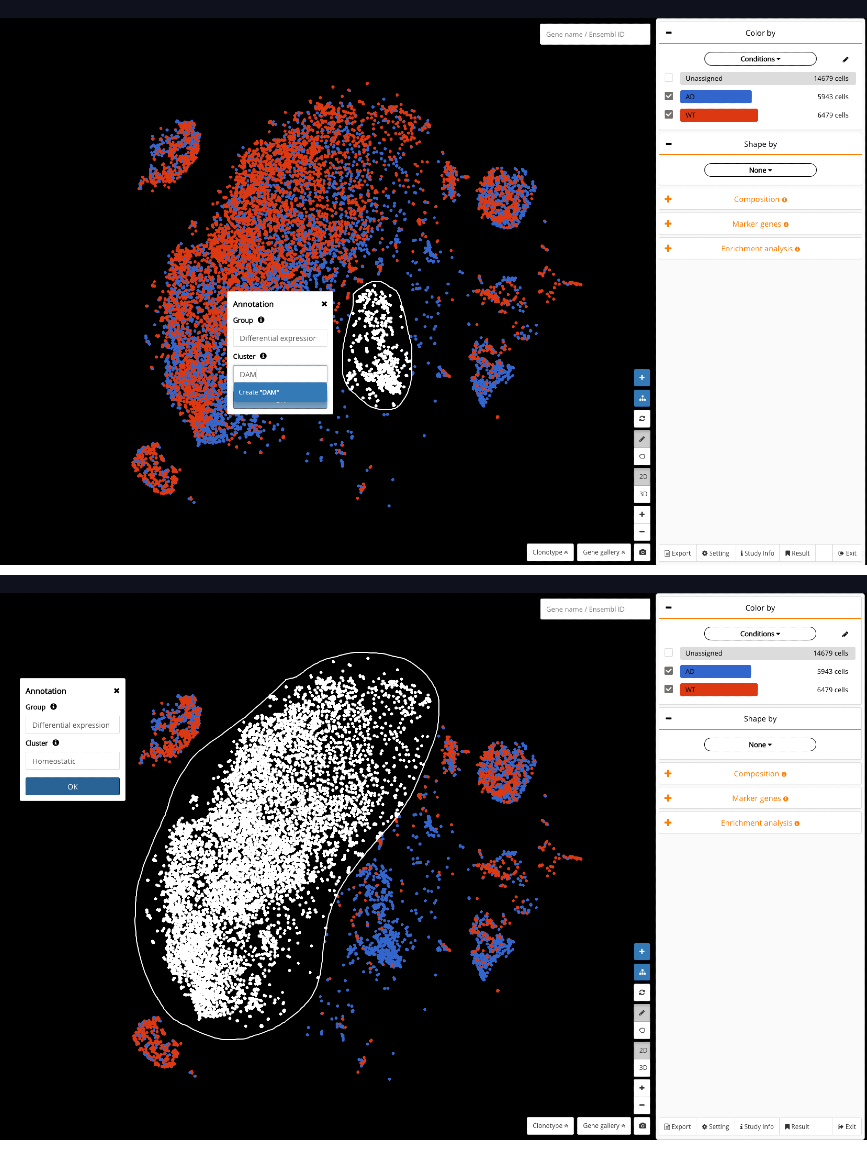
Fig 6. Annotating DAM (top) and homeostatic microglia (bottom) under one annotation group “Differential expression”
Step 4: Circle the region that contains both populations of interest, view composition, and run DE analysis
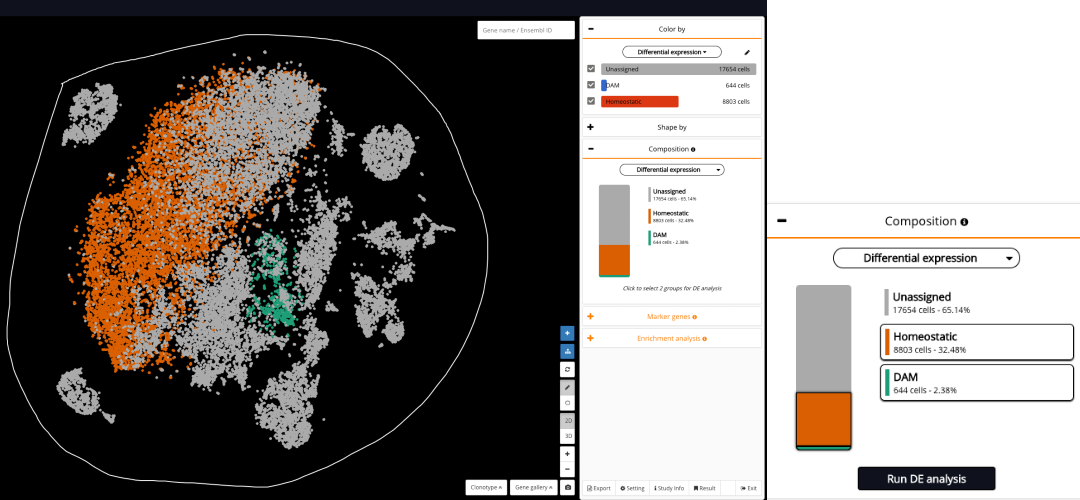
Fig 7. Circling the region that contains both the DAM and the homeostatic microglia, and viewing its composition by the annotation group that you just created (“Differential expression”)
After annotating the DAM and the homeostatic microglia under one annotation group (“Differential expression”), you just need to circle the region that contains both of them and view the composition by the annotation group that you just created (Fig 7). BioTuring Browser will show the two populations, DAM and homeostatic microglia, in the composition box. Just click on their names, and click Run DE analysis.
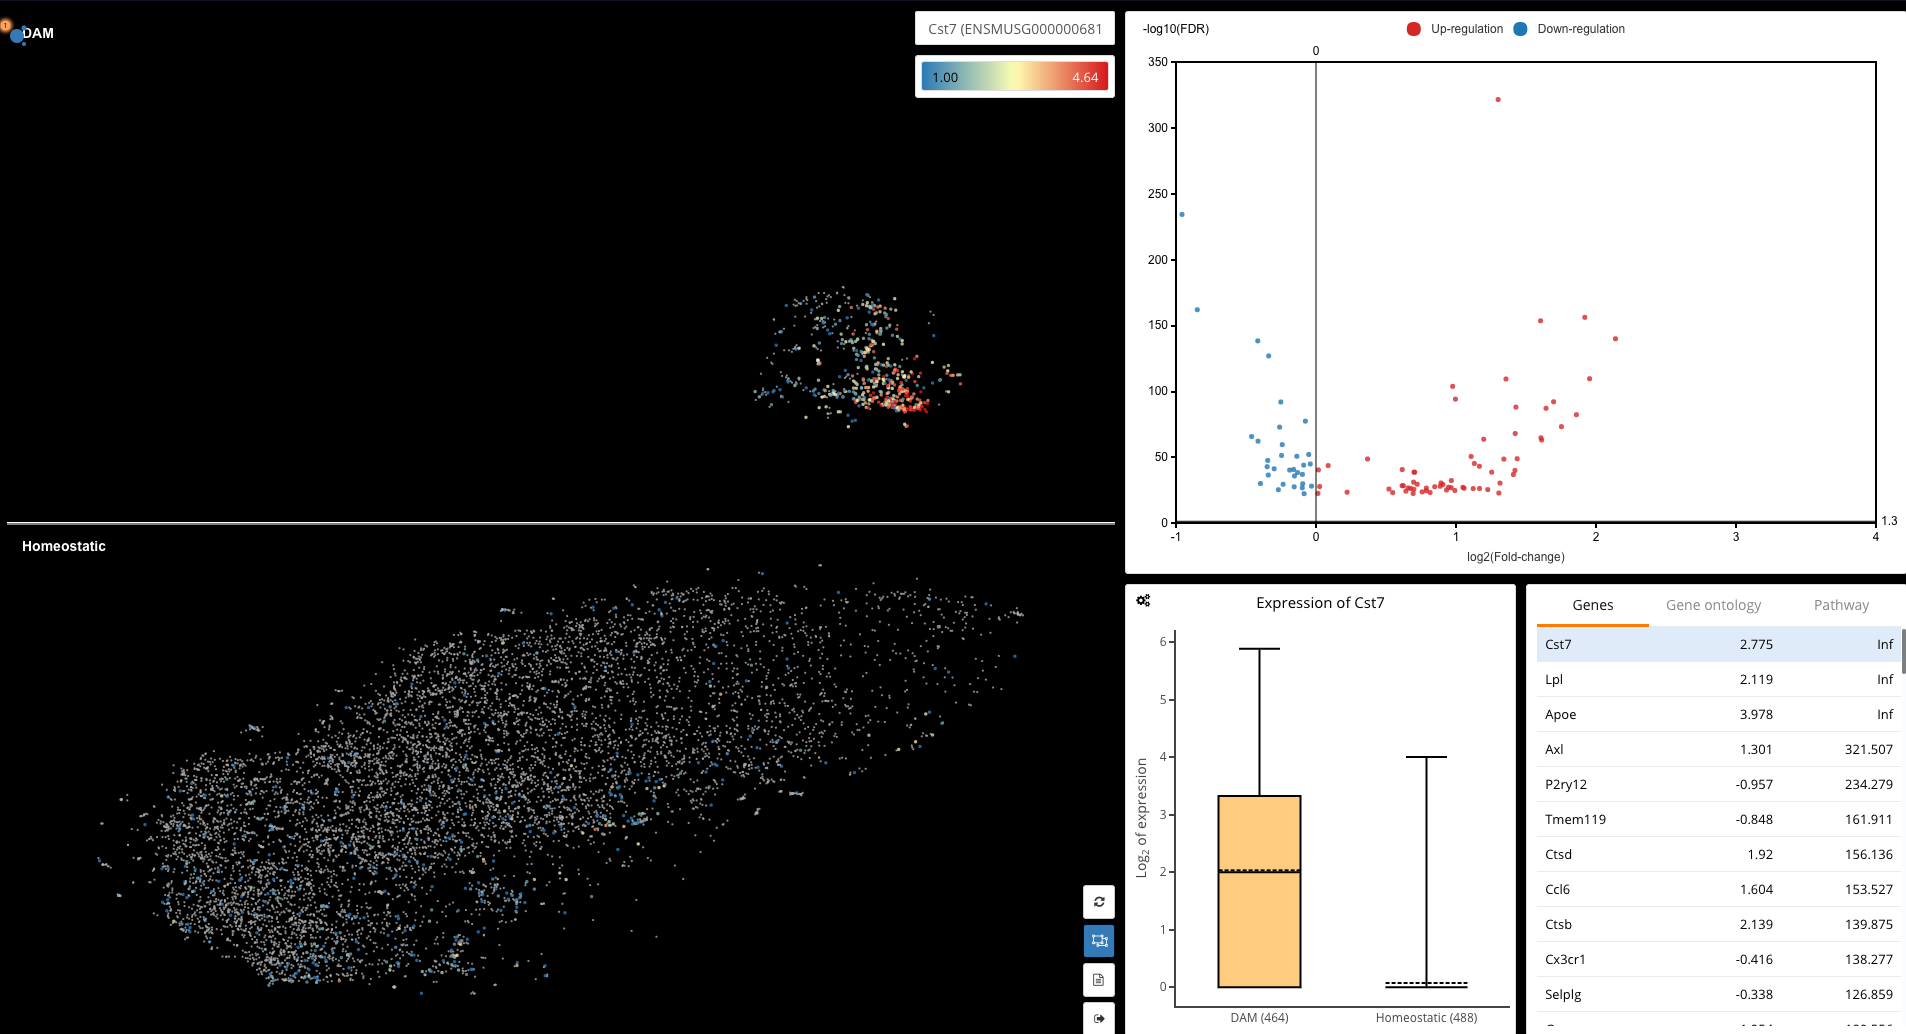
Fig 8. Single-cell differential expression dashboard of DAM and homeostatic microglia in BioTuring Browser
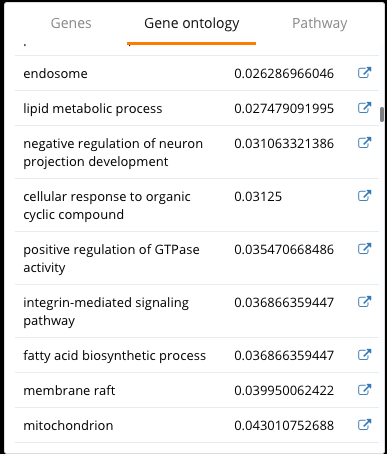
Fig 9. Gene ontology results from the differential expression analysis between DAM and homeostatic microglia in BioTuring Browser
We finally enter the differential expression dashboard of DAM and homeostatic microglia. Significant genes are displayed on the volcano plots and in the table underneath, with p-values and fold-change values, next to which is a box plot of gene expression. Every time you select a gene on the list or the volcano plot, the box plot will change accordingly.
Among the DE genes reported by BioTuring Browser, we detect Lpl, Apoe and Cst7, which is consistent with the results in the study. Gene ontology enrichment also shows that DAM exhibits a signature of lipid metabolism genes, as reported by Keren-Shaul and colleagues.
3. What method does it use?
BioTuring Single-cell Browser allows users to choose different methods for differential expression analysis, including glmQLFTest function in edgeR package and Venice, a fast and accurate approach to find marker/differentially expressed genes.
—
Above are 4 simple steps to run single-cell differential expression analysis in BioTuring Single-cell Browser without any code involved. This dataset by Keren-Shaul and colleagues is also available in BBrowser’s public single-cell data repository for quick access and reanalysis by the community.
BioTuring Single-cell Browser is available for free download at: https://bioturing.com/product/bbrowser
References:
- Keren-Shaul, Hadas, et al. “A unique microglia type associated with restricting development of Alzheimer’s disease.” Cell 169.7 (2017): 1276-1290.
- Robinson, Mark D., Davis J. McCarthy, and Gordon K. Smyth. “edgeR: a Bioconductor package for differential expression analysis of digital gene expression data.” Bioinformatics 26.1 (2010): 139-140.
Note:
Besides AD, the study further investigated the immune populations during the aging process and in another neurodegenerative disease, namely ALS. However, to keep it simple, we will only focus on the AD and WT samples in this tutorial.
Kate
I do the differential expression analysis between two groups i select with the pencil (control vs treated). However, while a log2fc of a 2.3 is shown for one of the regulated transcripts, this difference is not reflected by either the box plot or violin plot. I use the default unit of gene expression as Log normalized value. Can this be issue or what can it be? How to know which gene expression unit to choose? Thanks!