single cell visualization Archives - BioTuring's Blog
Data analysis made easy. For biologists, especially.

Tag Archives: single cell visualization

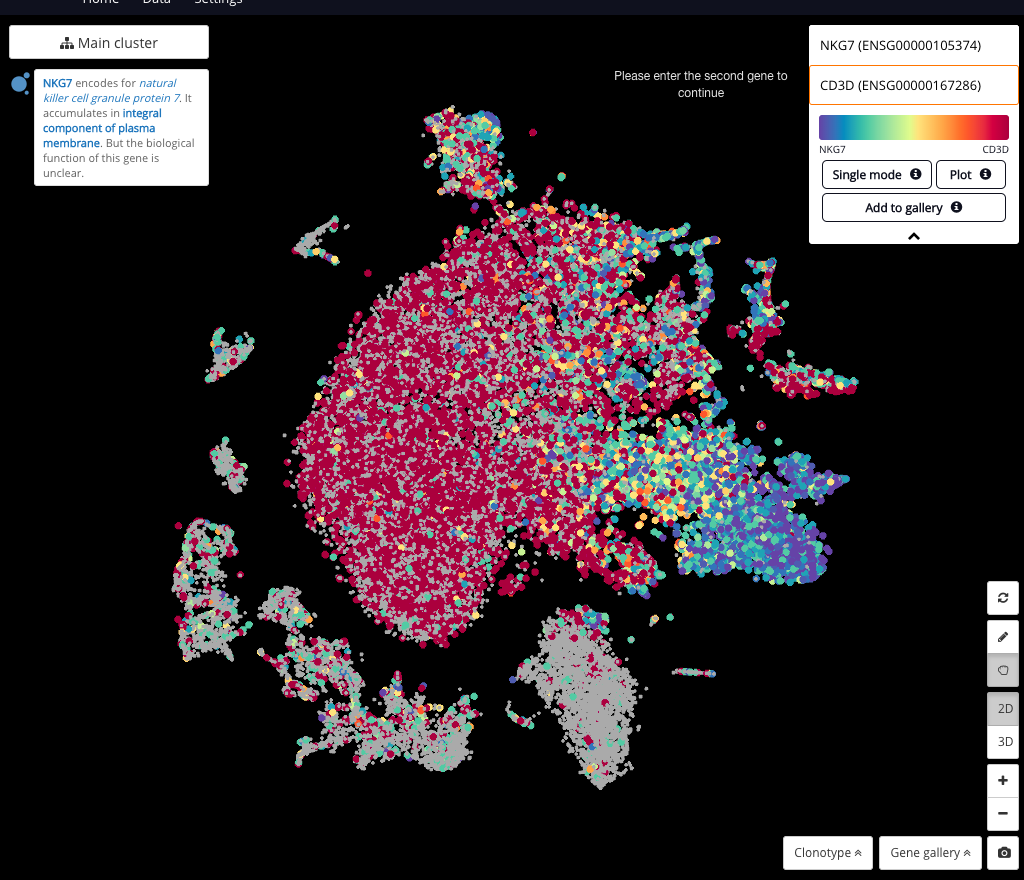
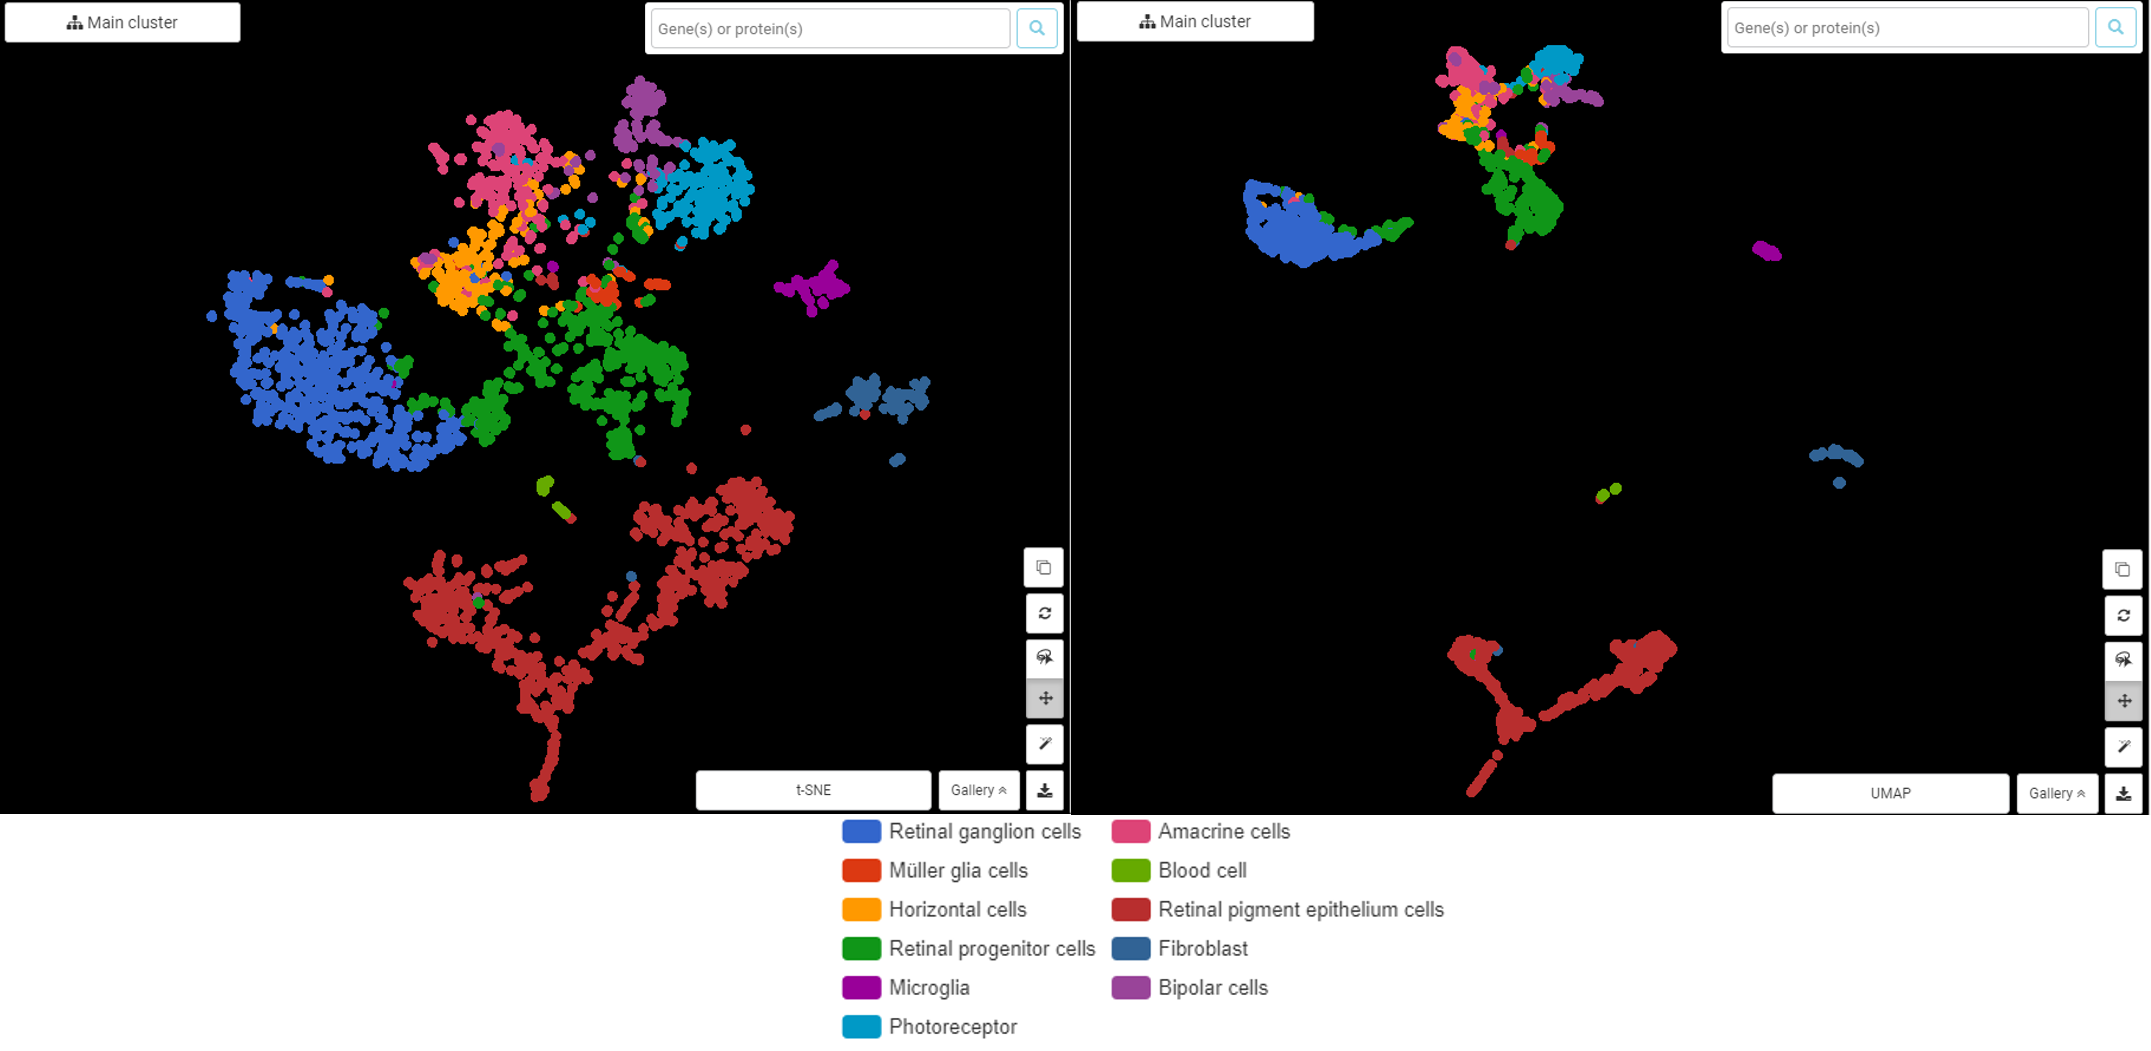
Comparing UMAP vs t-SNE in Single-cell RNA-Seq Data Visualization, Simply Explained
#
umap vs tsne global structure

How to Make Sense of Single-cell RNA Sequencing Data? Less is More Thanks to single-cell RNA sequencing (scRNA-seq), researchers are blessed with a trove of information. Yet, this blessing is also a curse in data visualization and further analysis! Since each cell is described by its gene expression profile, our […]

4 simple steps to perform differential expression analysis in single-cell data using BioTuring Browser
#

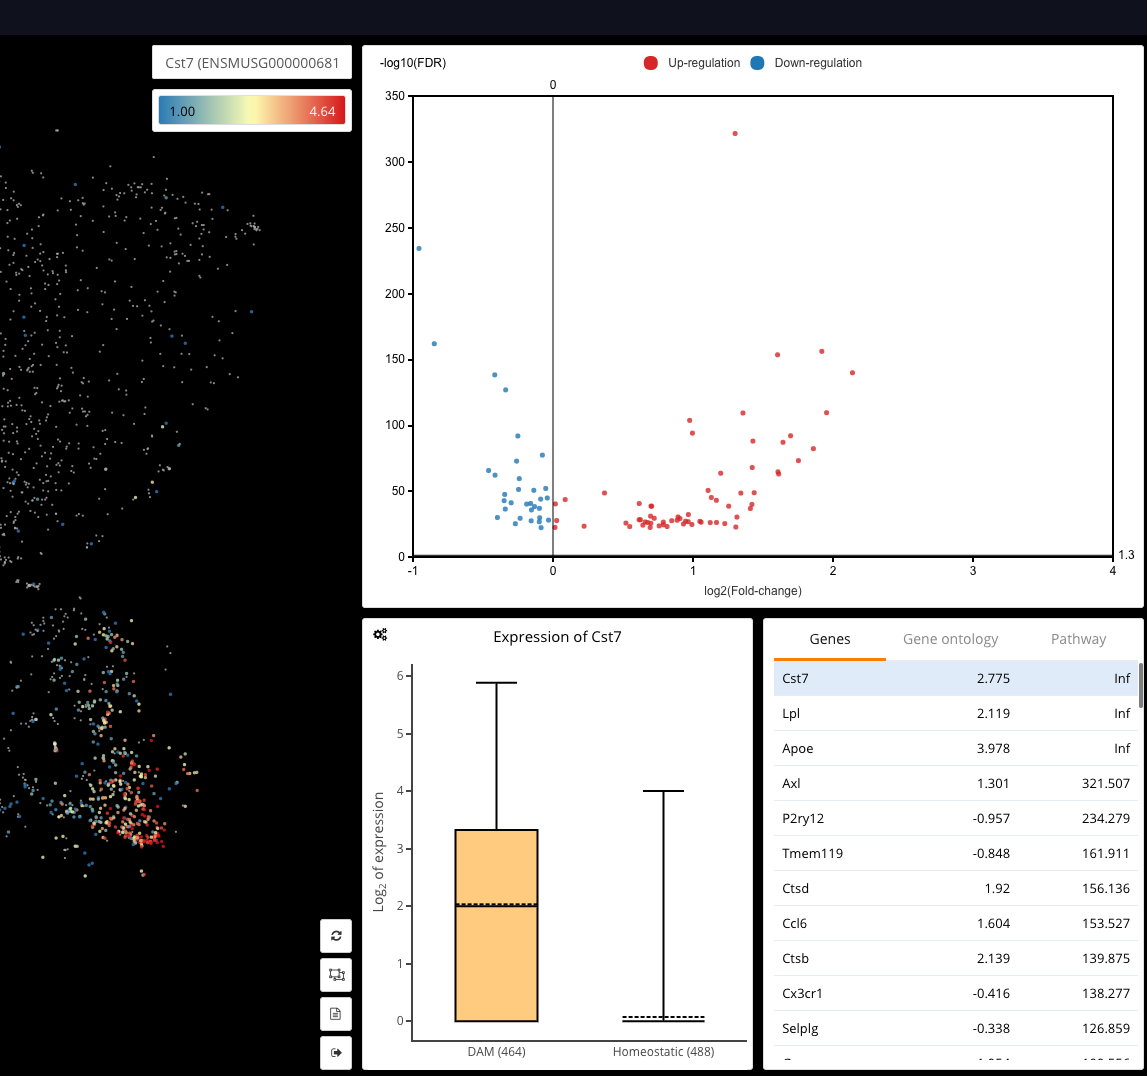
In single-cell data analysis, it is critical to understand how gene expression varies among different cell types, tissue compartments, conditions, or different patients. Although many tools and methods have been developed to support single-cell differential expression analysis, they all require some basic coding skills. In this blog, we show you […]

BioTuring Single-cell Browser: a modern interactive single-cell database with 3D visualizations and downstream analyses
#

Single-cell sequencing technologies have brought up an unprecedented level of resolution to omics studies with extremely detailed views into individual cells’ expression patterns. With the emergence of drop-based sequencing methods, the resolution now even comes with scale and efficiency. In a single experiment, scientists can now profile hundreds of thousands […]

BioTuring Browser: the software to resolve major challenges in single-cell RNA-seq data analysis
#

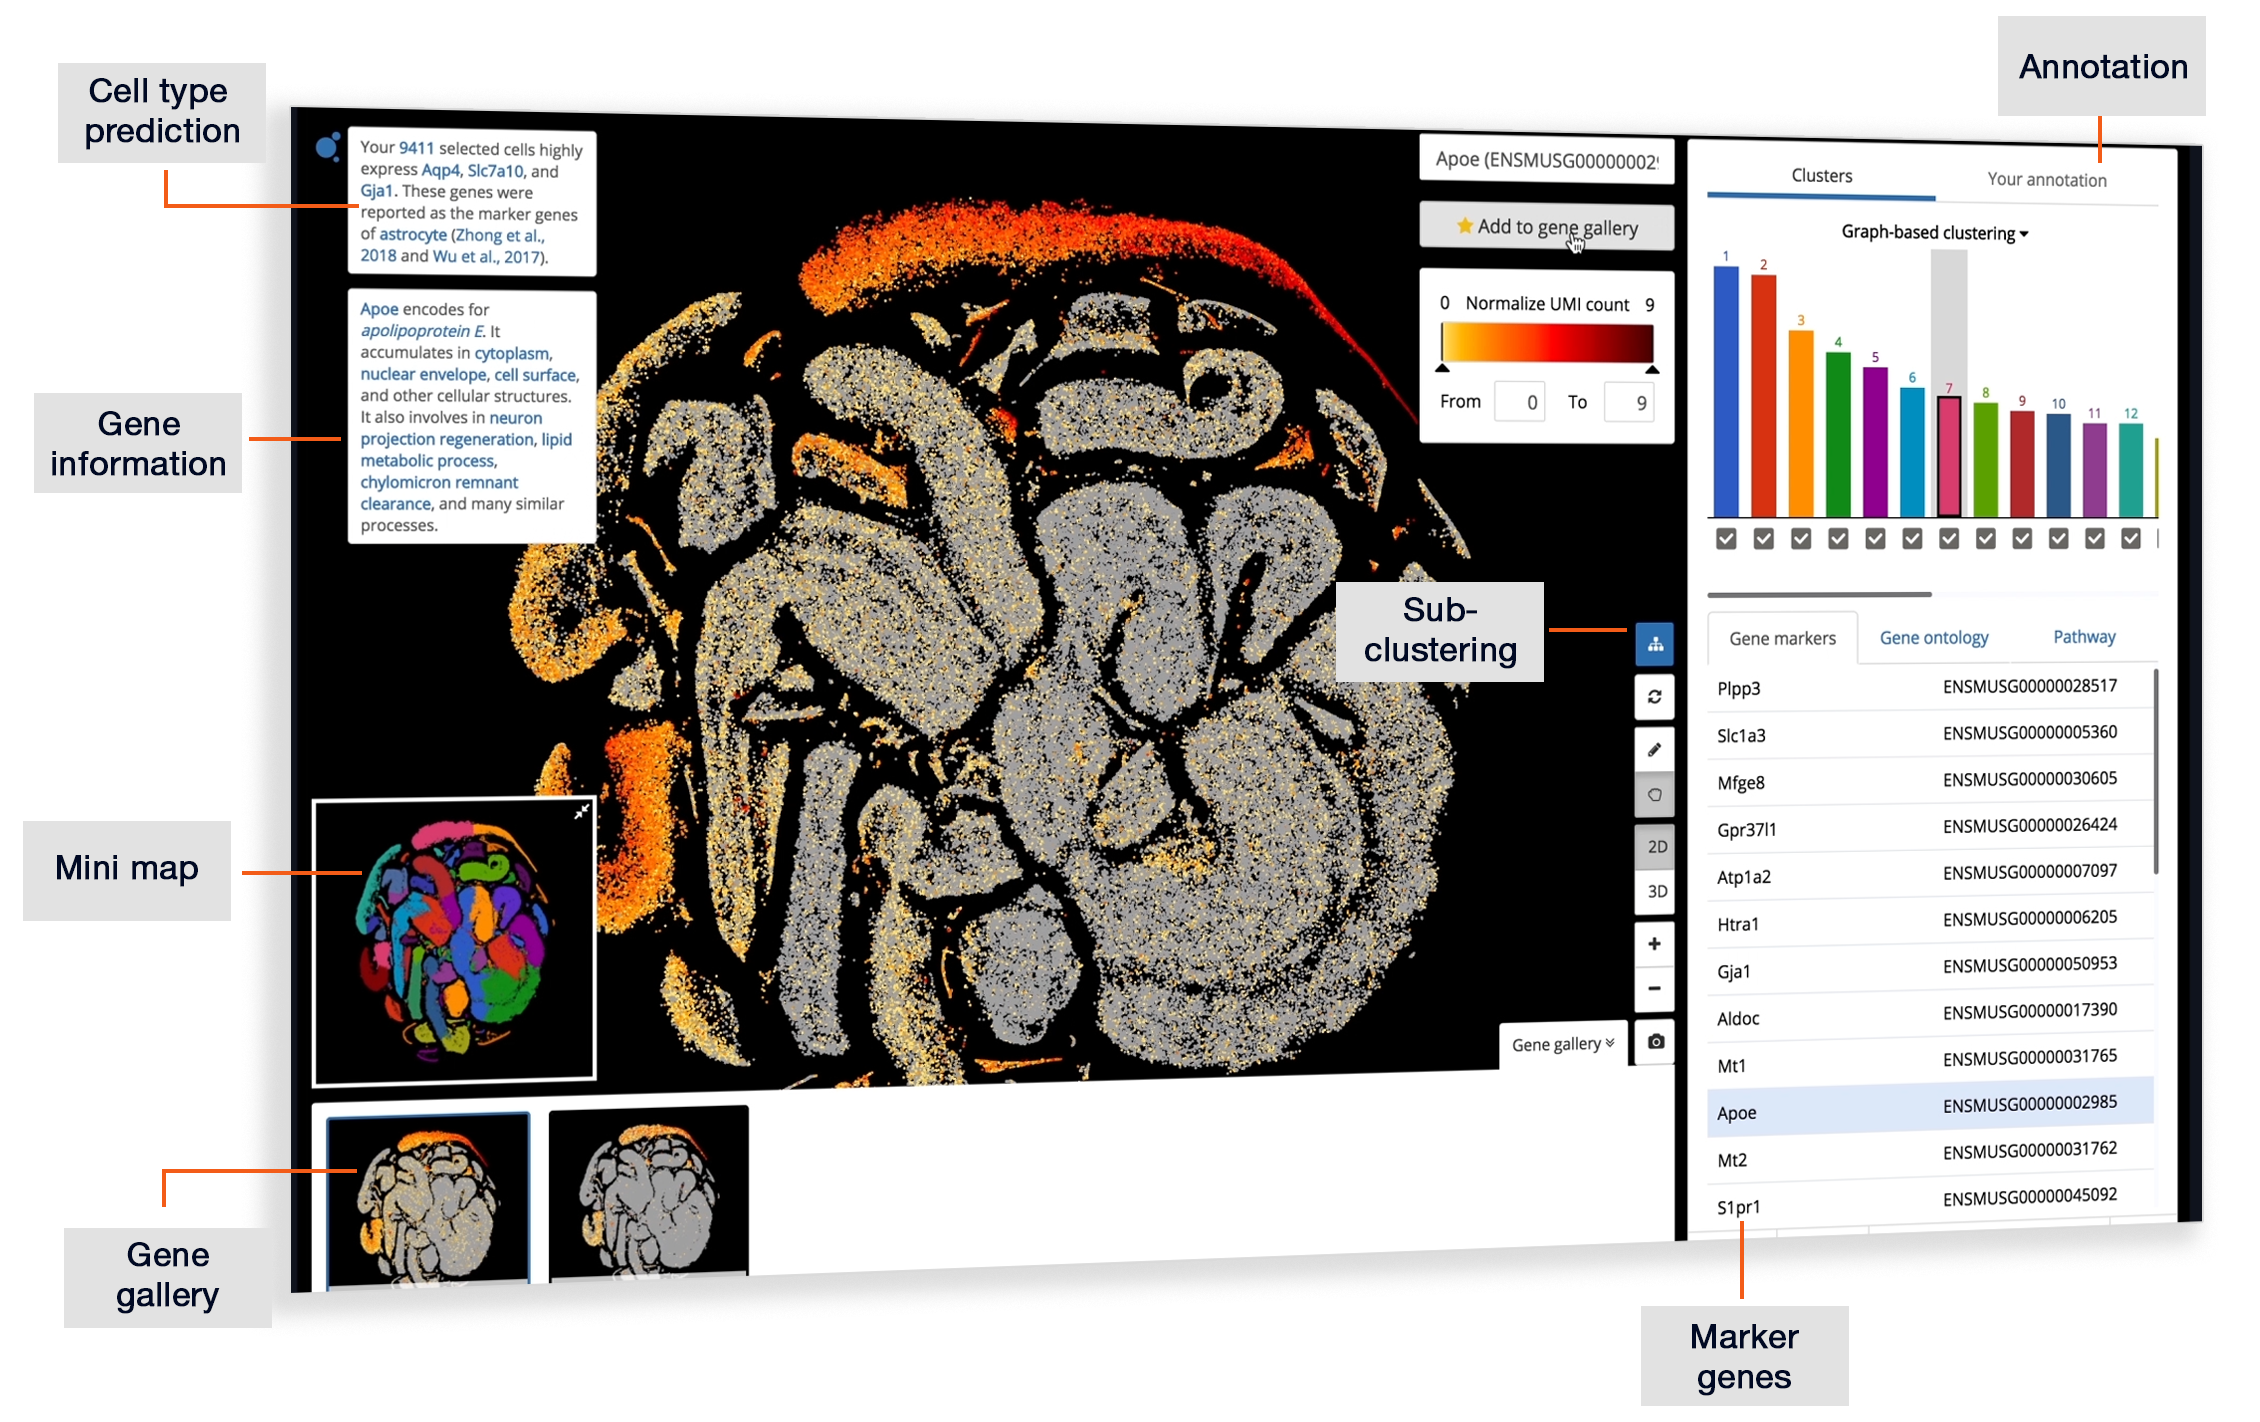
Single-cell RNA-seq technologies have opened up a completely new era for transcriptomic studies. For the first time ever, scientists can look at individual transcriptomic profiles of millions of cells, and better understand how each cell functions in a tissue. Yet science is confronting bigger challenges analyzing these massive amounts of […]