Single-cell RNA sequencing technologies have enabled many exciting discoveries of novel cell types and sub-types, such as the rosehip neurons (Boldog et al., 2018), disease-associated microglia (Keren-Shaul et al., 2017) and lipid-associated macrophages (Jaitin, Adlung, Thaiss, Weiner and Li et al., 2019). While sub-clustering cell populations is essential to find new sub-types, performing sub-clustering is difficult in most current single-cell analytics packages.
Here we provide a 3-step tutorial to help you easily sub-cluster any cell population and study its subsets using BioTuring Single-cell Browser (BBrowser). In this tutorial, we choose to look at an interesting immune dataset by Smillie, Biton, Ordovas-Montanes and colleagues (2019), “Intra- and Inter-cellular Rewiring of the Human Colon during Ulcerative Colitis”, and perform sub-clustering on the T cell populations, whose subsets are known for being extremely diverse and complex. As a result, we identified multiple T cell subsets, including PD-1+, IL-17+, activated, naive, regulatory, and exhausted T cells.
Before we proceed to the tutorial, make sure you have BBrowser installed and downloaded the dataset from BBrowser public data repository. BBrowser is available here >>>
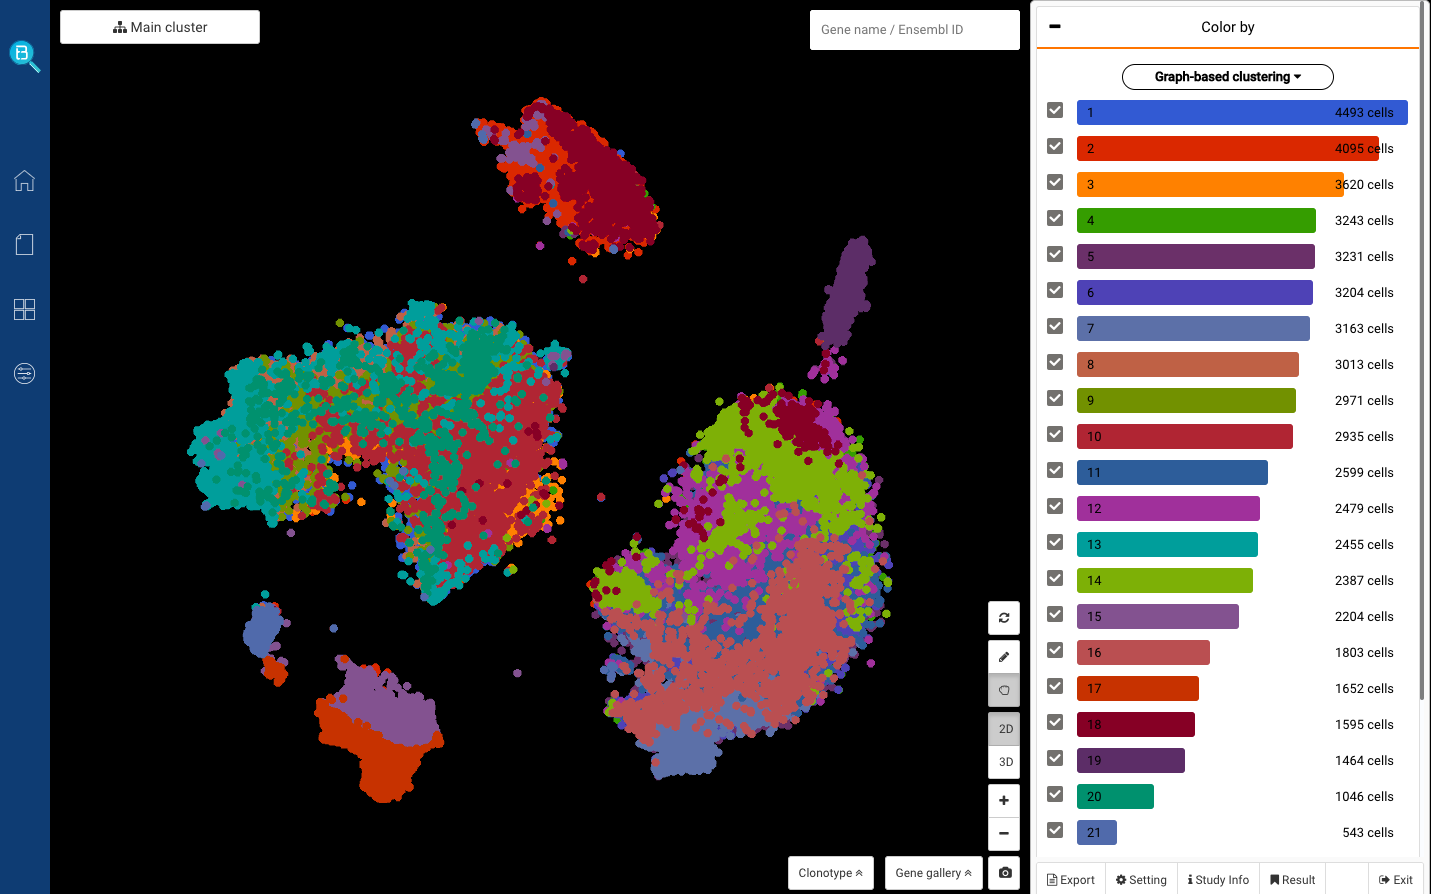
Fig 1. Dataset ““Intra- and Inter-cellular Rewiring of the Human Colon during Ulcerative Colitis”, visualized in BioTuring Browser (Accession ID: smillie2019.imm)
Experimental design
Sequencing 366,650 cells from the colon mucosa of 18 ulcerative colitis (UC) patients and 12 healthy individuals, the study identified 51 epithelial, stromal, and immune cell subsets, making up an important atlas of the human colon. For this tutorial, we will only examine the immune dataset, consisting of 54,195 immune cells, including several groups of B and plasma cells, myeloid cells, natural killers, and T cells. For T cells, the study identified various subsets, among which were regulatory T cells ( T regs), memory, MT-hi, activated, IL-17+, and PD-1+ T cells.
Step 1: Find the T cells with CD3 expression
To sub-cluster T cells, we first need to identify the T-cell population in the data. Here we query their marker gene CD3D, and identify them as the red cluster on the left (Fig 2).
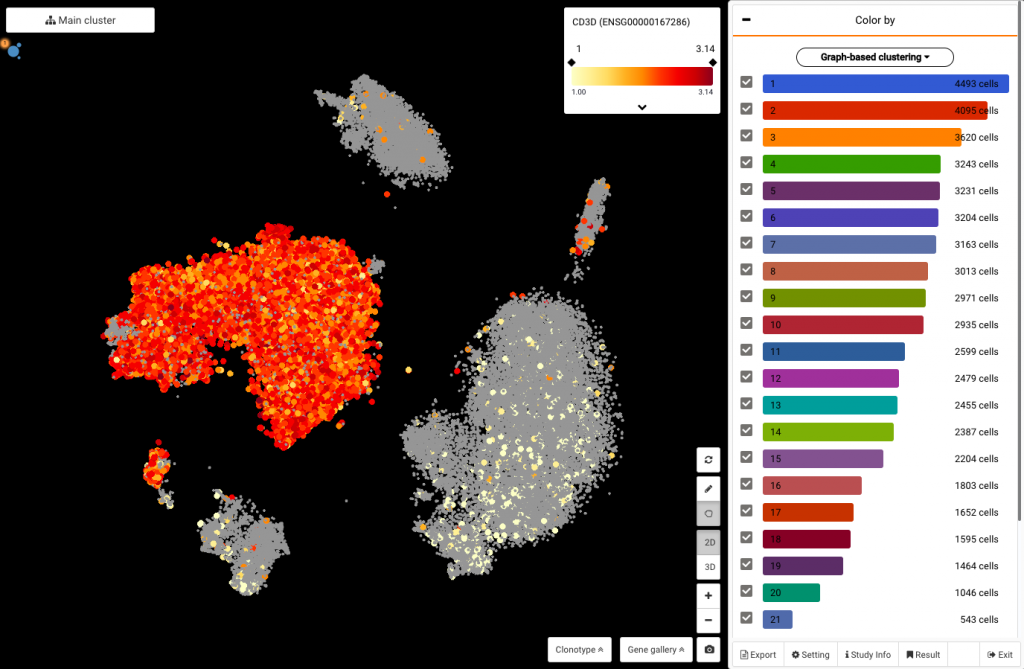
Fig 2. Querying CD3D expression to identify T cells
Step 2: Select T cells
By circling:
To select the T cells that you just found, simply click the pencil tool , and circle the highlighted region (Fig 3).
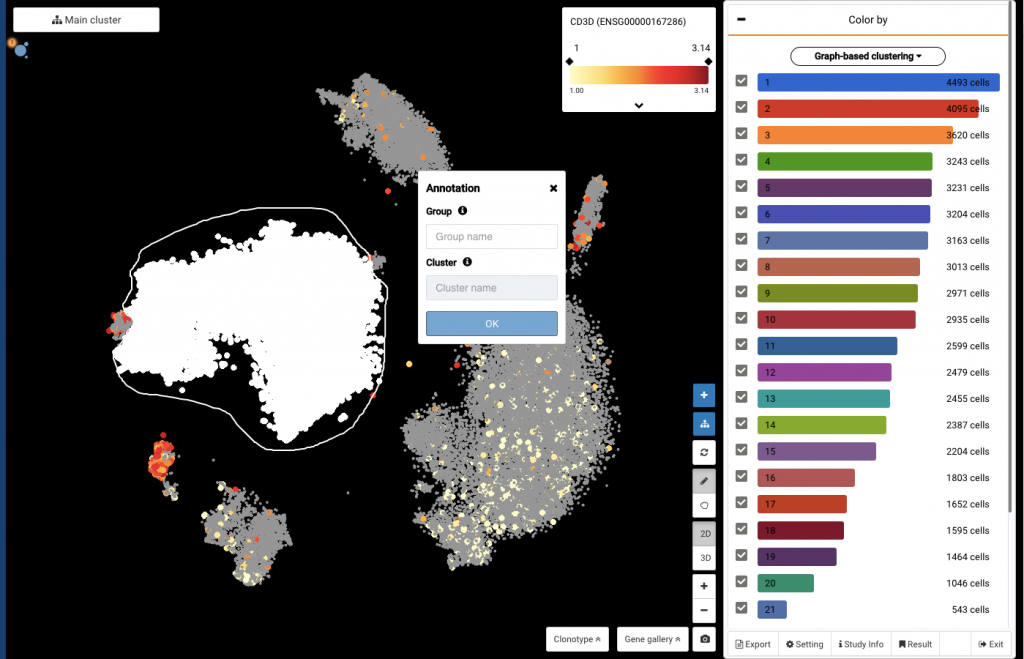
Fig 3. Selecting T cells for sub-clustering by pencil tool
By gene expression:
You can also select the cells by gene expression level. Just query CD3D on the top-corner box, and tap at the color scale to select all cells whose CD3D expression levels are larger than 1. If you want to narrow down the thresholds, simply click at the expression values on both sides of the color scale and input the new numbers.
Once the cells are selected, the software will highlight them in white (Fig 4).
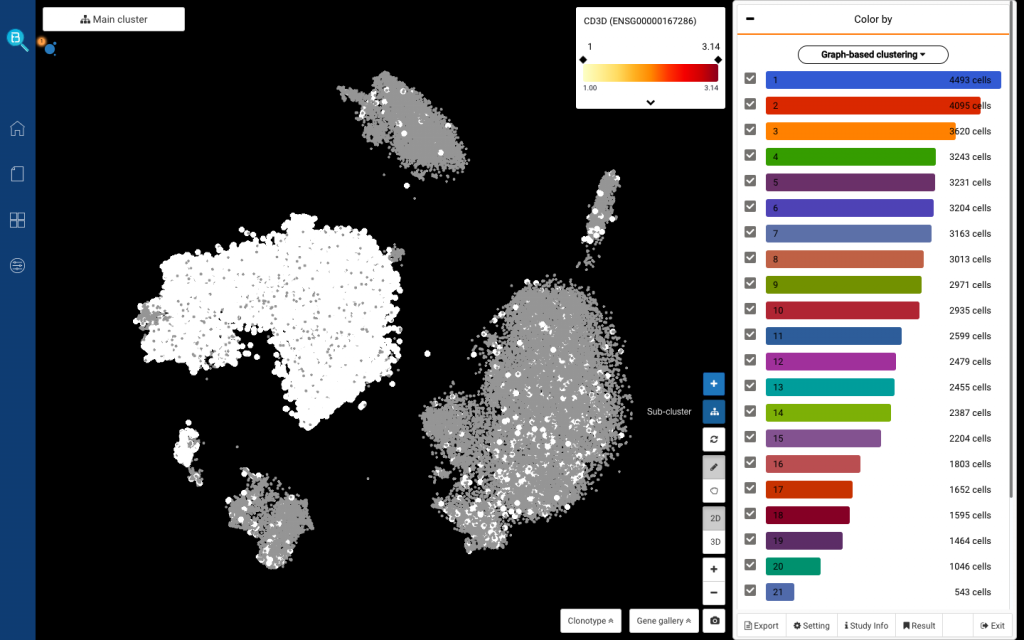
Fig 4. After querying CD3D, tap at the color scale to select all the cells with positive CD3D expression. You can also change the expression thresholds by clicking at the expression values on both sides of the color scale.
Step 3: Sub-cluster the population
To perform sub-clustering on the T cells you just selected, just click the Sub-cluster button (Fig. 5). Then you will be asked to name the sub-clustering analysis you are running, and click Apply.
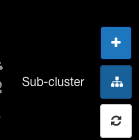
Fig 5. The Sub-cluster button
After that, BBrowser will run an entire pipeline for sub-clustering, including:
- Principal component analysis
- Graph-based clustering by the igraph package (Csardi and Nepusz, 2006)
- k-means clustering (Neter et al., 1998)
- t-SNE (Maaten and Hinton, 2008)
Time to explore the T cell subsets
By selecting a precalculated sub-cluster and finding markers
After a few minutes, here comes the sub-clustering dashboard. You can click on any sub-cluster under the Color-by dashboard and click Find marker genes (Fig 6). Here you will get a list of marker genes for the sub-cluster you just selected.
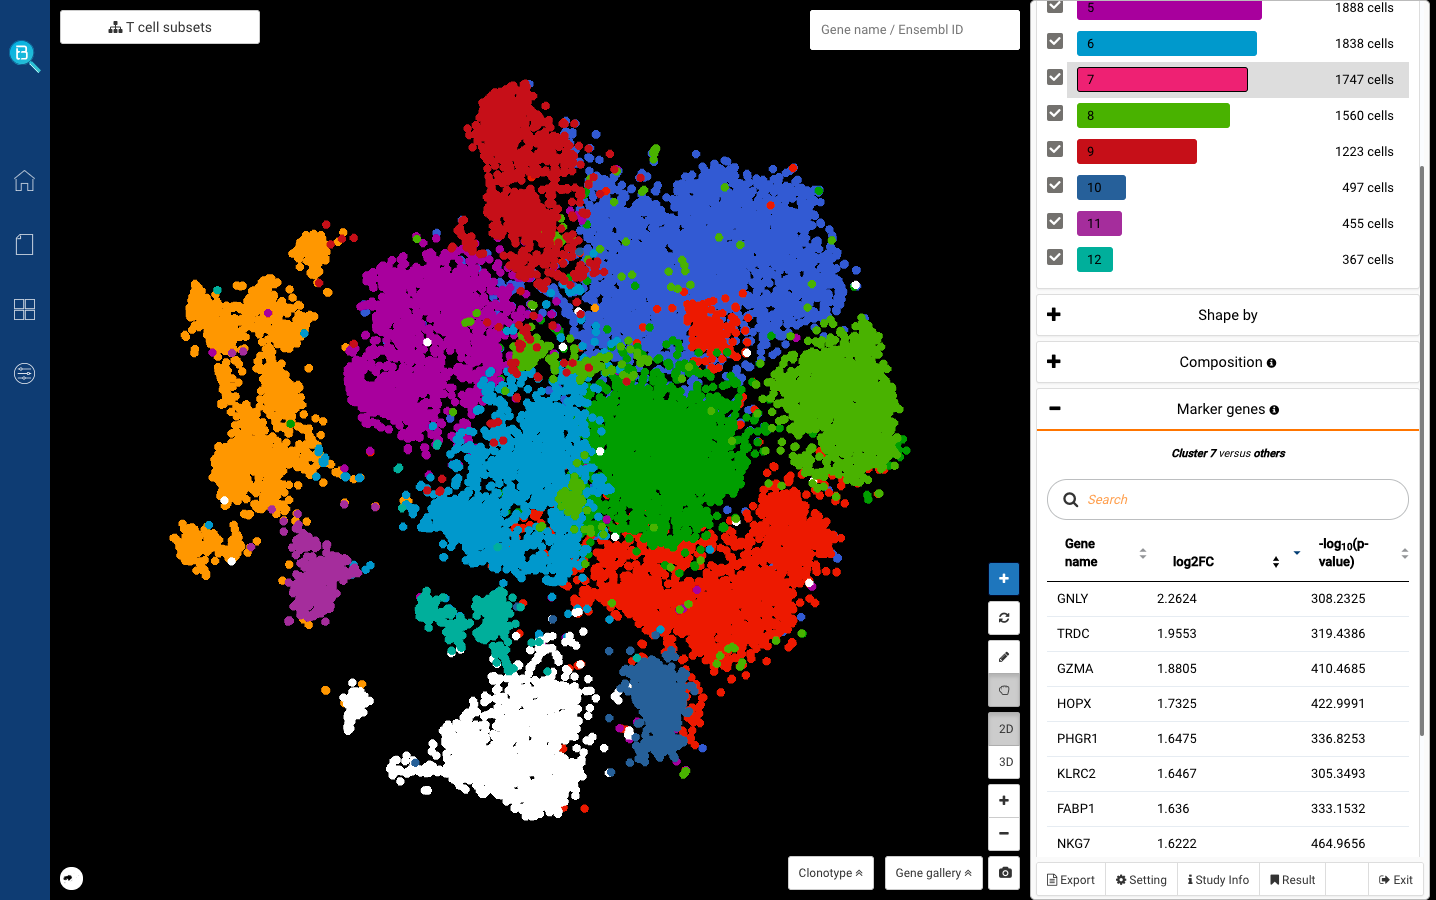
Fig 6. Sub-clustering dashboard of T cells: Just click on any sub-clusters under the Color-by dashboard and click Find marker genes to explore its markers. Here in the screenshot we are showing sub-cluster 7’s markers, including GNLY, GZMA, and NKG7. These are known markers for cytotoxic T cells (Zheng et al., 2017).
We first clicked at sub-cluster 7, and detected several known markers for cytotoxic T cells: GNLY, GZMA, NKG7 (Smillie, Biton, Ordovas-Montanes et al., 2019) (Fig. 6,7). Sub-cluster 9, meanwhile, highly expressed CCR7, known for being the marker of naive T cells (Zheng et al., 2017) (Fig. 8).
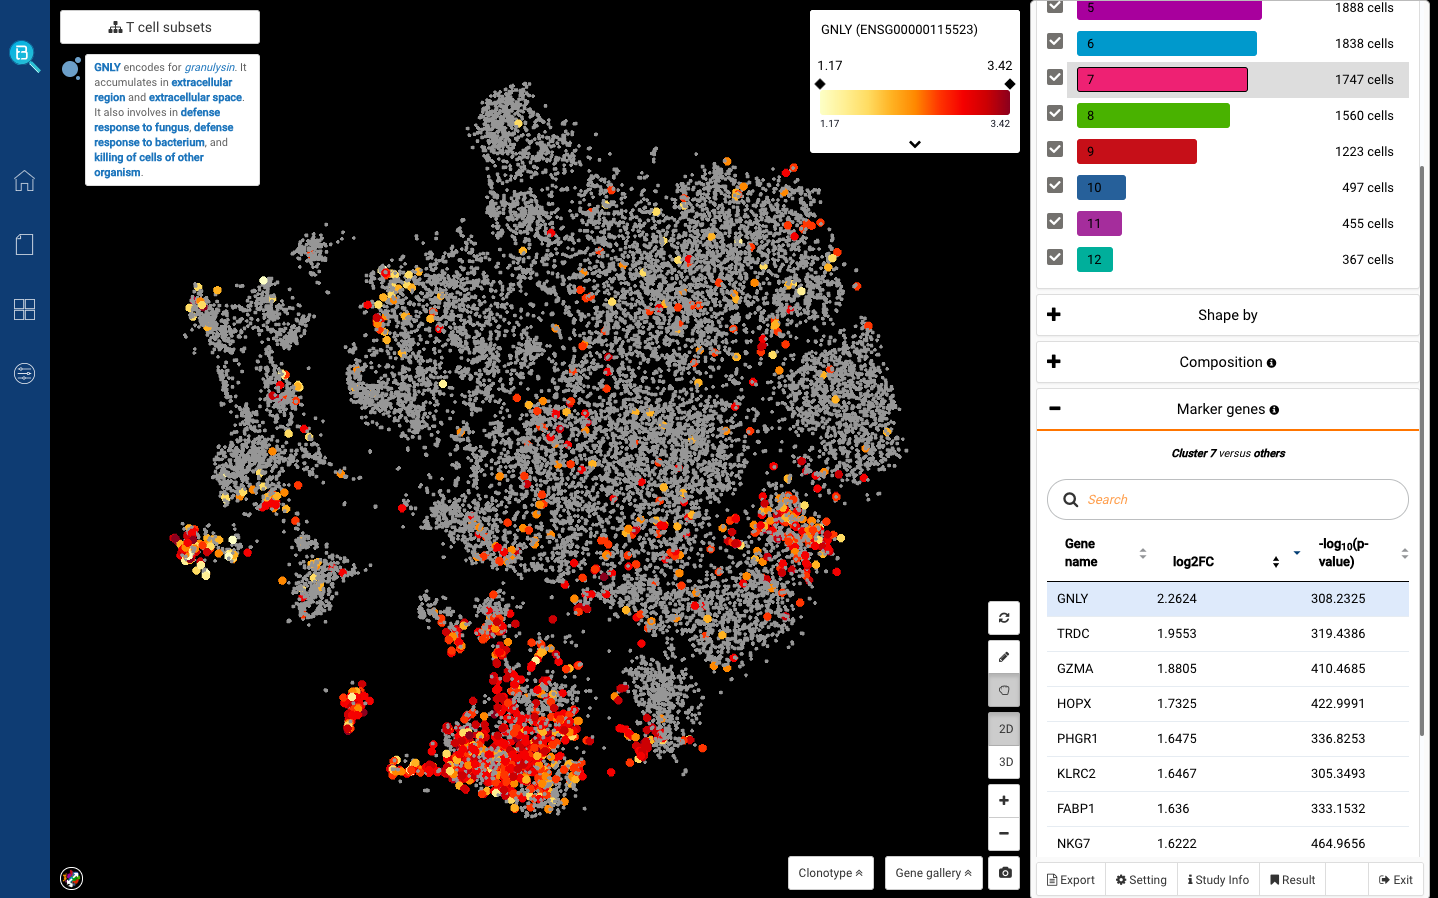
Fig 7. Sub-cluster 7: Cytotoxic T cells (GNLY+)
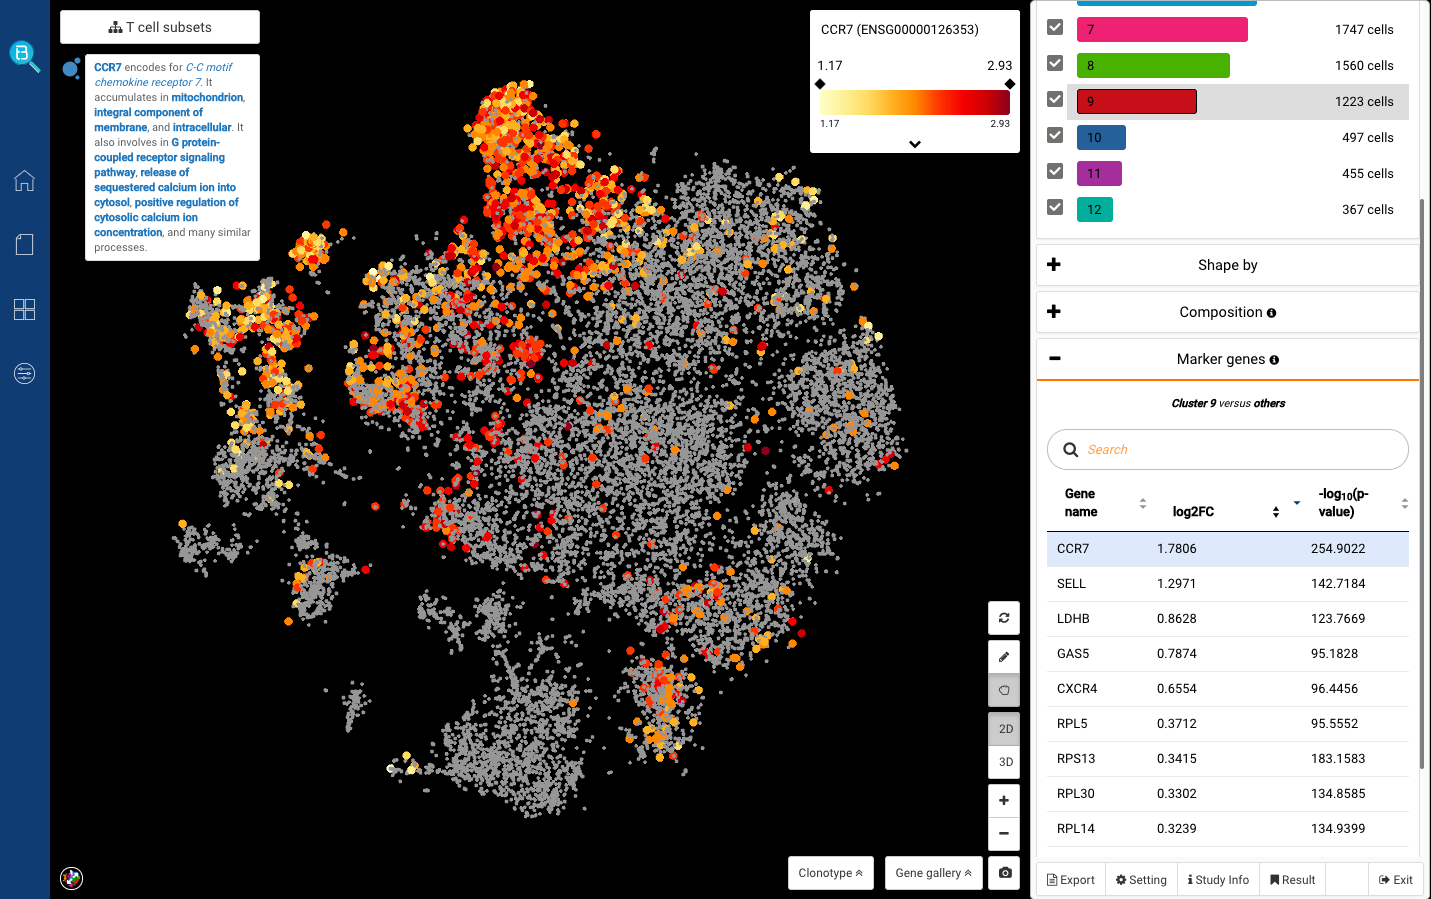
Fig 8. Cluster 9: Naive T cells (CCR7+)
With pencil tool and finding marker function:
Apart from selecting the pre-calculated sub-clusters, you can also circle any population and find marker genes for it. We tried finding markers for the distant population on the left corner, and found high expression of IL17A (Fig 9). That can be the IL-17+ T cell subset reported in the study.
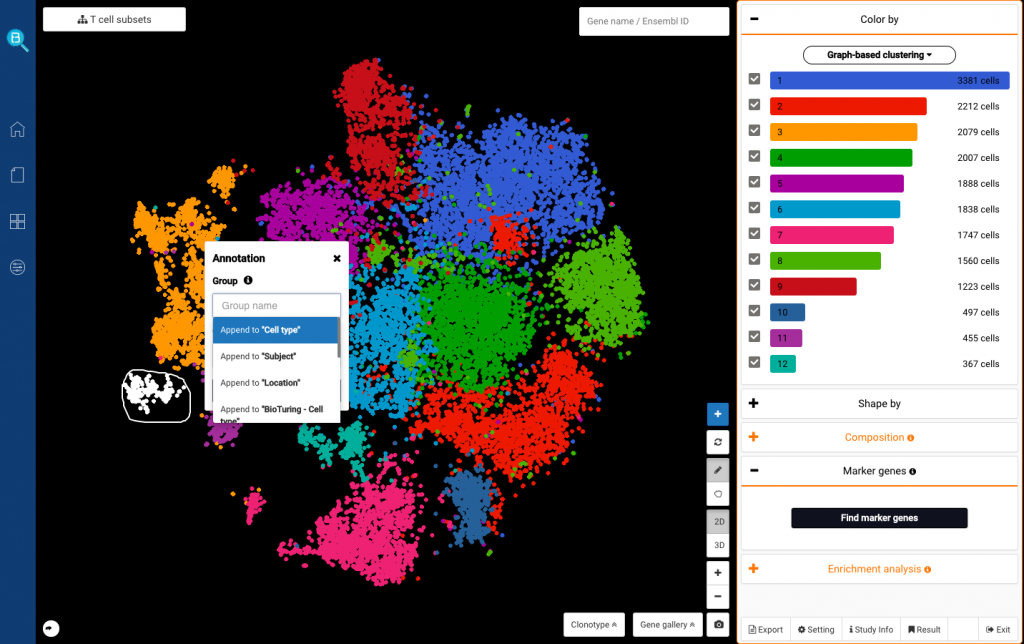
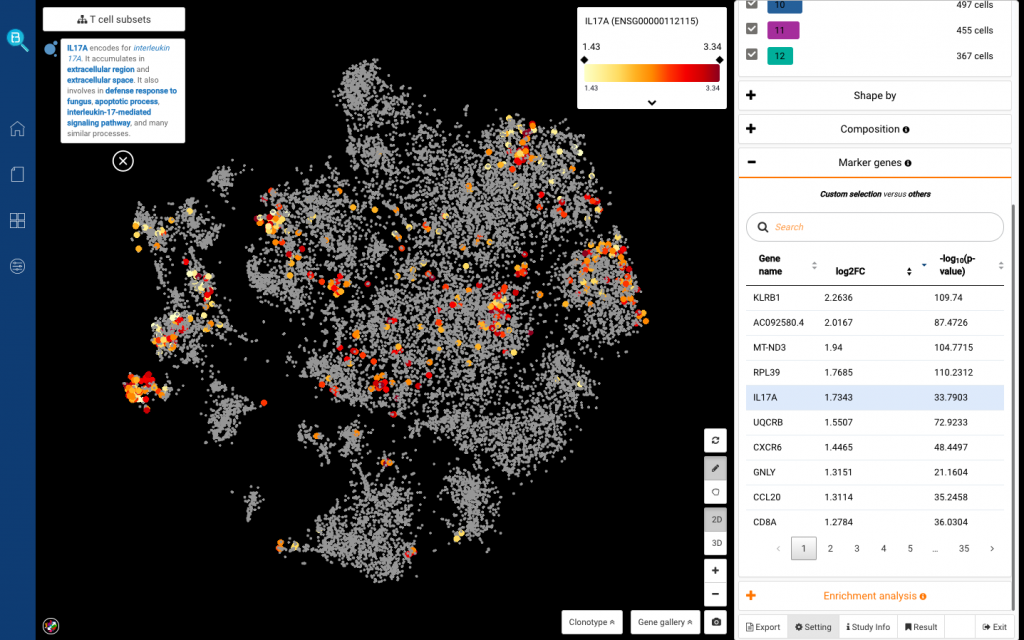
Fig 9. Circling a population on the left corner and finding marker genes (top). List of marker genes found by BBrowser (bottom)
By querying known marker genes’ expression:
Another way to identify the T cell subsets is by querying the known marker genes. We found Tregs by querying both of the known marker genes FOXP3 and CTLA4 (Zheng et al., 2017) (Fig 10). We also detected PD-1+ T cells with the expression of PDCD1 (Smillie, Biton, Ordovas-Montanes et al., 2019).
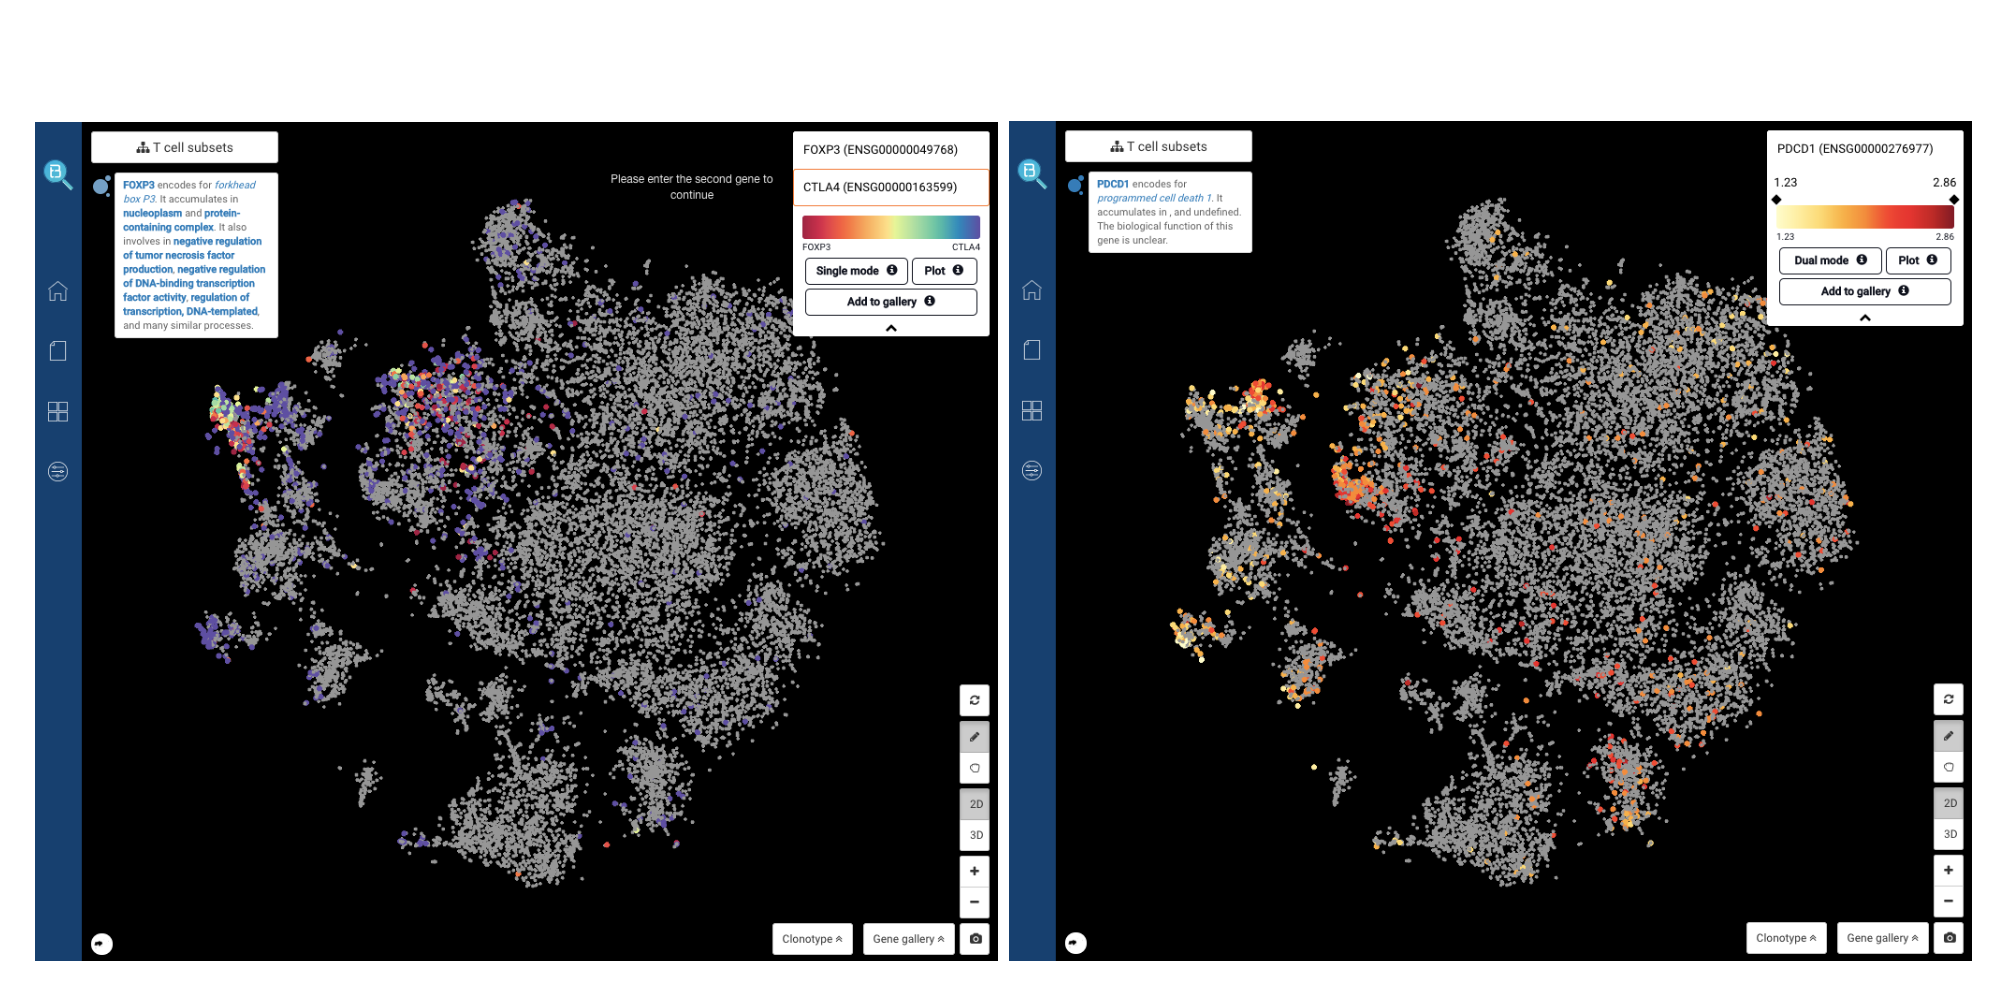
Fig. 10: Identifying T regs by the co-expression of FOXP3 and CTLA4 (left), and PD-1+ T cells by the expression of PDCD1 (right).
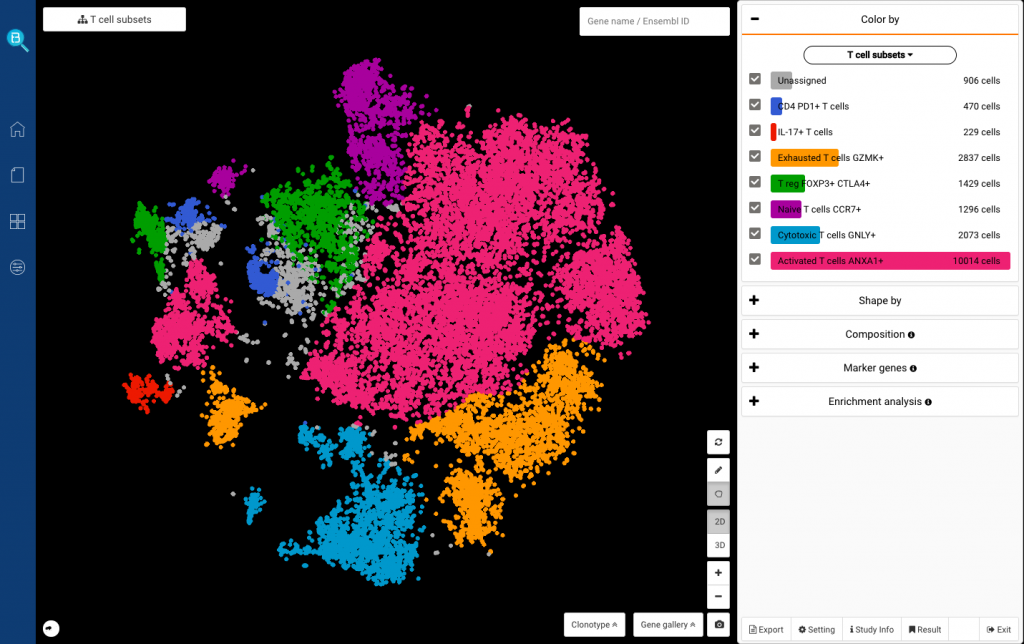
Fig. 11: Complete T cell subset identification, including Il-17+, PD-1+ (PDCD1+), Activated (ANXA1+), Naive (CCR7+), Regulatory (FOXP3+ CTLA4+), Cytotoxic (GNLY+) and Exhausted (GZMK+) T cells
That’s it! It only takes a few steps to explore the T cell subsets in the single-cell dataset of Smillie, Biton, Ordovas-Montanes et al. (2019) using BioTuring Browser. We were excited to identify several T cell subsets, including PD-1+, IL-17+, activated, naive, regulatory, and exhausted T cells. We hope you will be able to identify them as well and even more subsets on your own, after following the steps in this tutorial.
Feel free to leave your questions in the comment box below. If you need some help with BBrowser, contact us at support@bioturing.com. We would be happy to walk you through it.