Nominated as Method of the year by Nature in 2019, single-cell multimodal omics has enabled scientists to uncover many facets of the cells by simultaneously measuring multiple modalities in one single-cell experiment. One candidate for multimodal analysis is CITE-Seq, a technique that layers cell surface protein information on top of single-cell transcriptomic data, allowing researchers to explore the cells from both the inside (gene expression) and outside (surface protein) – at the same time, and for the first time ever.
To help scientists easily perform CITE-Seq data analysis and visualization, we adopted the single-cell multimodal analysis workflow of Seurat into BioTuring Browser, an interactive platform for state-of-the-art single-cell data analysis. With just mouse clicks and an interactive interface, scientists can now:
- Query surface protein expression,
- Explore the protein t-SNE and feature plots interactively,
- Flexibly select cells for further analyses.
The new CITE-Seq data analysis module also opens up a new branch of BioTuring Browser public repository, allowing users to instantly explore latest CITE-Seq datasets from high-impact publications in an interactive approach. BioTuring Browser is available for download at www.bioturing.com/bbrowser.
To see BioTuring Browser CITE-Seq data analysis capabilities, we revisit some analyses of Stoeckius et. al for the CBMC dataset from the original paper of CITE-Seq (GSE100866).
Input
For TotalSeq B chemistry (10X Genomics Feature Barcoding data)
TotalSeq B data generated by 10X Genomics Feature Barcoding can be directly imported into BioTuring Browser in raw count matrices (.MTX) or in Seurat/Scanpy objects.
For TotalSeq A chemistry or others
For TotalSeq A data or data from any other technologies, you can convert them into the standard format of 10X Genomics data and import into BioTuring Browser. Another way is to import Seurat or Scanpy objects into BioTuring Browser for visualization and downstream analyses.
For the work of Stoeckius et. al, we use MTX import to load the data into BioTuring Browser.
Interactive visualization with t-SNE
BioTuring Browser supports t-SNE for both transcriptome and protein expression information, which is computed from the pairwise-distance matrix of all cells, following the tutorial of Seurat (https://satijalab.org/seurat/v3.1/multimodal_vignette.html). The t-SNE plots can be easily switched among with a single button in BioTuring Browser.
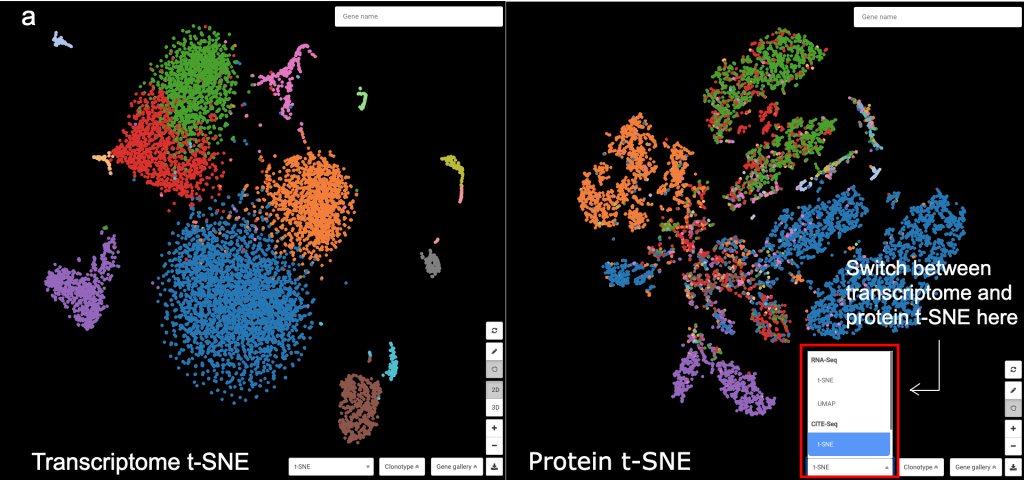
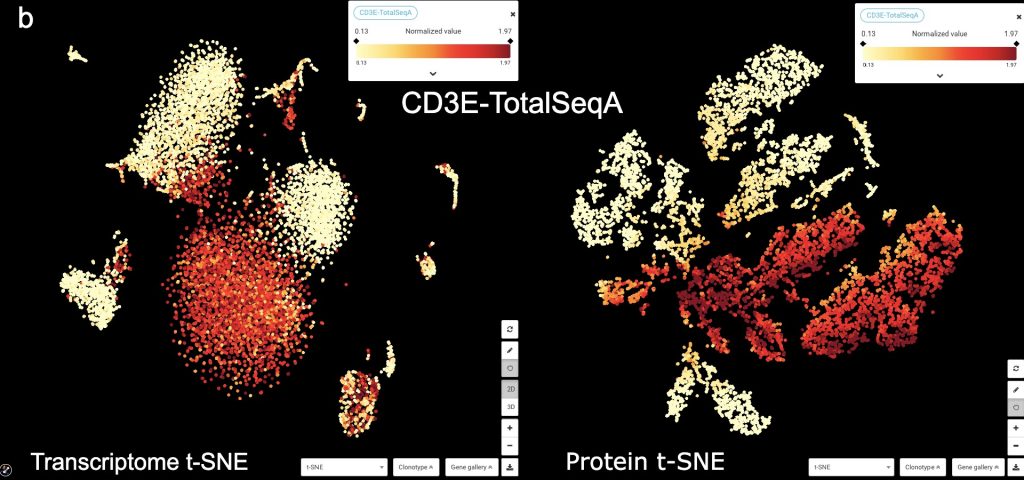
Figure 1: Transcriptome vs. Protein t-SNE in BioTuring Browser, colored by (a) graph-based clustering result, (b) CD3E protein expression
Interactive Feature Plot
In the original paper, Stoeckius et. al tested the ability of CITE-Seq data to separate quantitatively two groups of cells based on the expression of surface protein. In the new version of BioTuring Browser, we introduce Feature Plot, a new feature that allows users to draw a bi-axial plot of two features, which can be a gene or a protein. This function is a complement that fosters the cell annotation routine.
In Figure 2a, we use the two proteins CD3E and CD19 to separate B cells and T cells population. Then among T cells, we use CD4 and CD8A to annotate the two most abundant groups, CD4 T cells and CD8 T cells.
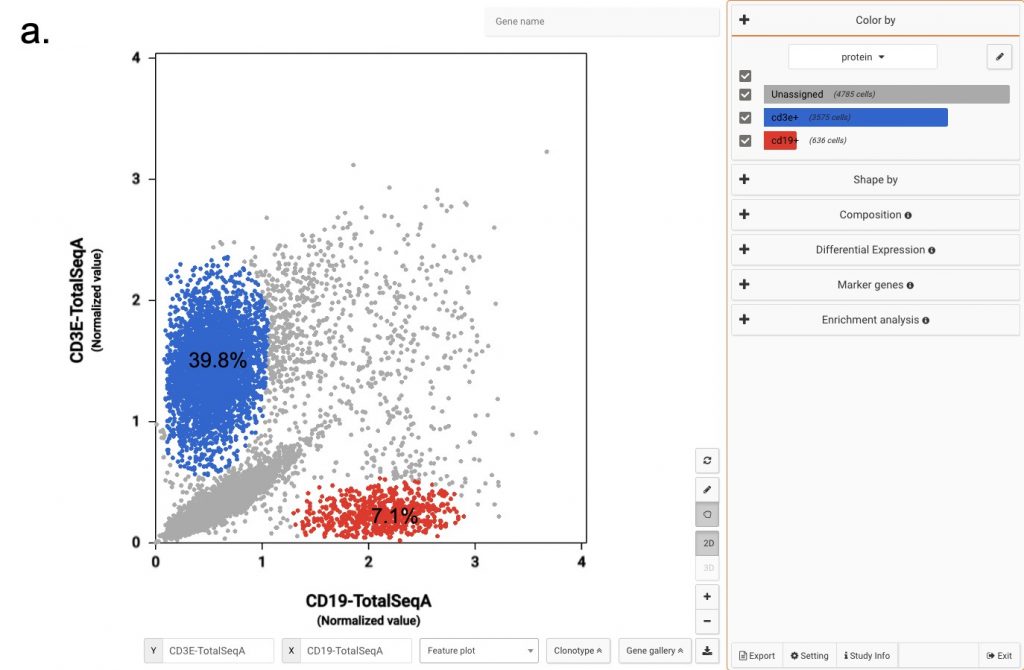
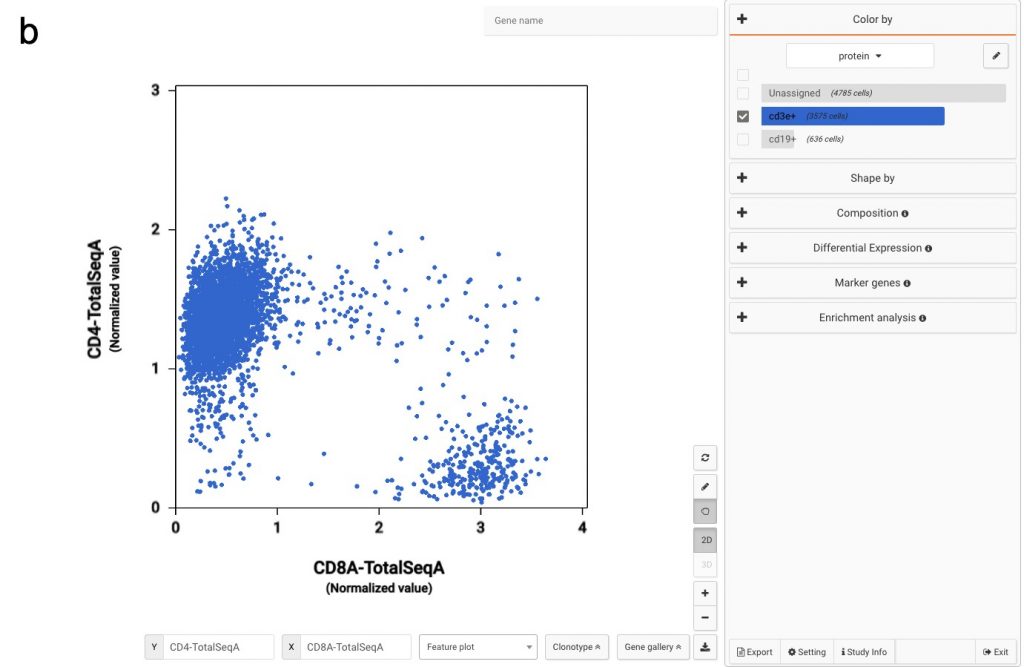
Figure 2: Using convention protein marker to separate important immune cell populations (a) T cells and B cells (b) CD4 T cells and CD8 T cells
Select cells for further analyses
At your own discretion, you can use the lasso tool to select any cell populations on the protein t-SNE or Feature plot and perform various downstream analyses. Such can be sub-clustering – to explore sub-populations of the selected cells, studying cell composition, differential expression analysis, finding gene markers and protein markers, etc.
BioTuring Browser with CITE-Seq data analysis is available for download at www.bioturing.com/bbrowser
–
Reference:
Stoeckius, Marlon, et al. "Simultaneous epitope and transcriptome measurement in single cells." Nature methods 14.9 (2017): 865.