BioVinci: high-dimensional data visualization made easy for biologists - BioTuring's Blog
  • Solutions

      For single-cell sequencing data

    • BioTuring Single Cell Browser
      • What is it?
      • Download
      • Request a quote/demo
      • Document
      • FAQ
    • Hera-T
    • For RNA sequencing data

    • Hera
    • Other solutions

    • BioVinci
    • Bioinformatics partnerships
  • Resources
    • Webinars
    • Blog
    • Videos
  • Forum
    • Profile
    • Setting
    • Log out
  • navigation
    • About us

    • Solutions

        For single-cell sequencing data

      • BioTuring Single Cell Browser
        • What is it?
        • Download
        • Request a quote/demo
        • Document
      • Hera-T
      • For RNA sequencing data

      • Hera
      • Other solutions

      • BioVinci
      • Bioinformatics partnerships
    • Resources

      • Webinars
      • Blog
      • Videos
    • Forum

    • Careers

    • Contact us

    Log in| Sign up
    1. Home
    2. Box plots
    3. Data visualization and analysis
    4. Heatmap
    5. Principal component analysis
    6. Venn diagrams
    7. Violin plots
    8. BioVinci: high-dimensional data visualization made easy for biologists

    BioTuring's Blog

    Data analysis made easy. For biologists, especially.

    6,000,000 cells
    at ease with
    BioTuring Browser
    Explore now
    Box plots, Data visualization and analysis, Heatmap, Principal component analysis, Venn diagrams, Violin plots

    BioVinci: high-dimensional data visualization made easy for biologists

    by biomembers • April 24, 2020 September 21, 2020
    analysis tool, automated machine learning, high-dimensional data visualization, ISOMAP, LLE, Machine learning, pca, t-SNE, UMAP

    “How to extract the biology behind this huge matrix of thousands of rows and columns?” 

    Large numbers of data points hold valuable biological stories yet are tricky to graph and analyze. Imagine you had the data for 1000 features and observations, your mind would be full of questions, wondering how to treat it in the right way, what is the go-to visualization method for it, and how to identify the most important features. 

    To make high-dimensional data visualization and analysis less tricky, we developed BioVinci 2.0, a package that brings automated machine learning and modern visualizations to life sciences. You can easily get BioVinci to recommend the best-fit visualization method for your high-dimensional data, and automatically extract the important features to help you interpret the biological stories.

    BioVinci 2.0 also inherits the interactive drag-and-drop interface and diverse plot editing options from Version 1.0 , allowing you to make your biological insights publication-ready.


    How can BioVinci 2.0 support you?

    Automatically find the best dimensionality reduction method for your data

    You don’t need to think about which visualization method fits your high-dimensional data best. BioVinci is here to automatically find the best algorithm to convert your thousand-dimension data into 2D and 3D visualizations, such as PCA, UMAP, t-SNE, ISOMAP, and LLE.   

     PCA-Principal component analysis, a method that transforms data to a new coordinate system by projecting each data point onto a group of orthogonal axes. Read our blog explaining PCA here.

    t-SNE – t-distributed Stochastic Neighbor Embedding, a well-suited method for visualizing high-dimensional data in two or three dimensions.

    UMAP – Uniform Manifold Approximation and Projection for Dimension Reduction, a method has a better presentation with geographic data and processing speed than t-SNE. 

    ISOMAP, a method is to compute a quasi-isometric, low-dimensional embedding of a set of high-dimensional data points.

    LLE – locally linear embedding, is used to discover nonlinear structure in high-dimensional data by utilizing the local symmetries of linear reorganization. 


    Extract important features and explain your data using a decision tree model

    Upon importing your data for dimensionality reduction, BioVinci will automatically detect the most important features and explain your data using a decision tree model. The function helps you to easily spot the key features (eg. genes, proteins, peptides,…) that classify your data. 
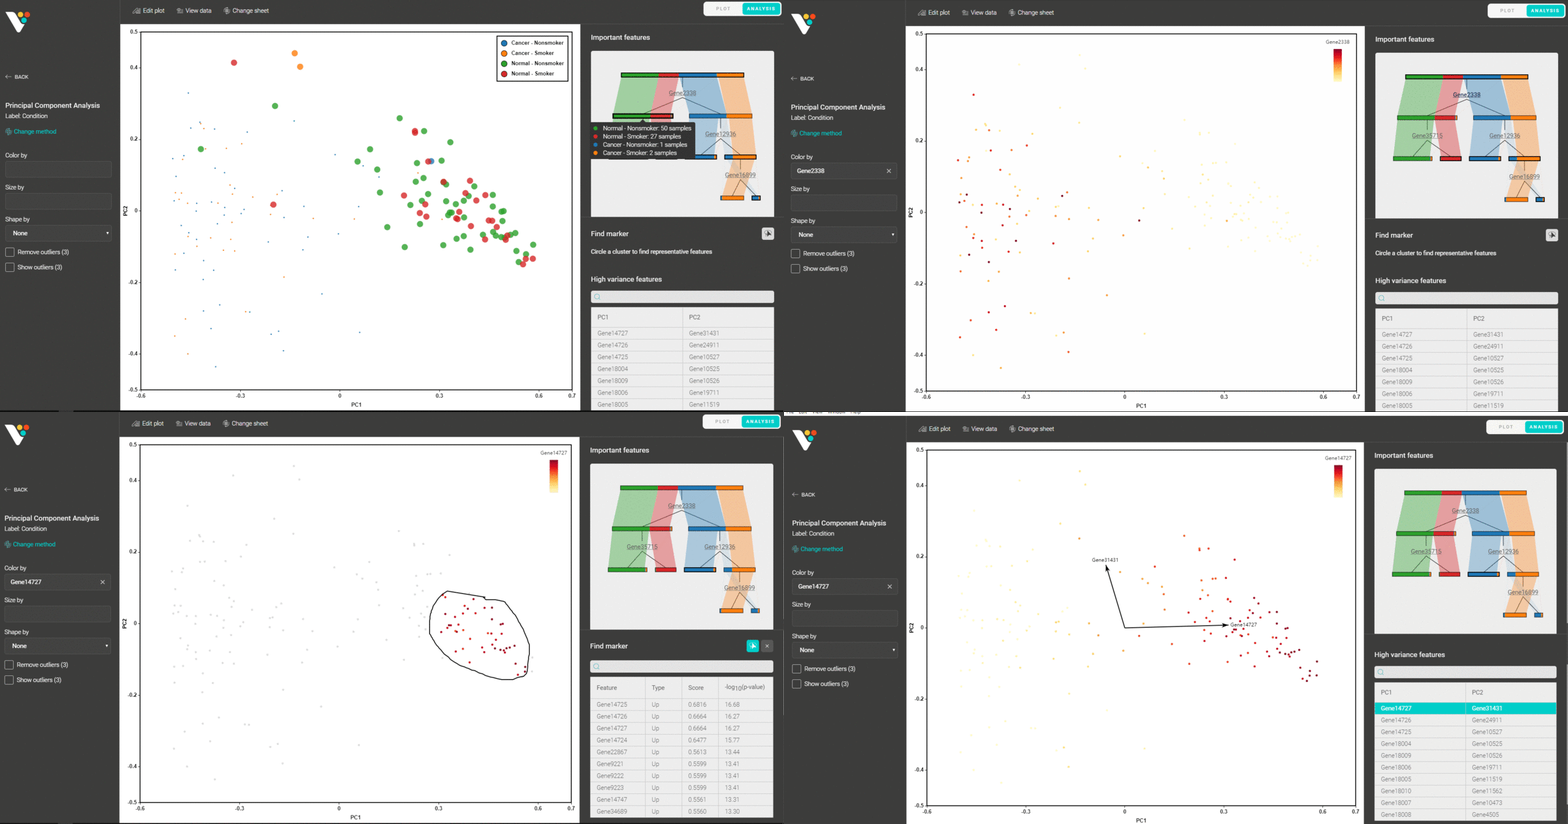
    You can also circle any group of data points and find the representative features that distinguish them from the remaining groups.

    Easily customize output plots for publication and enjoy other modern plot options

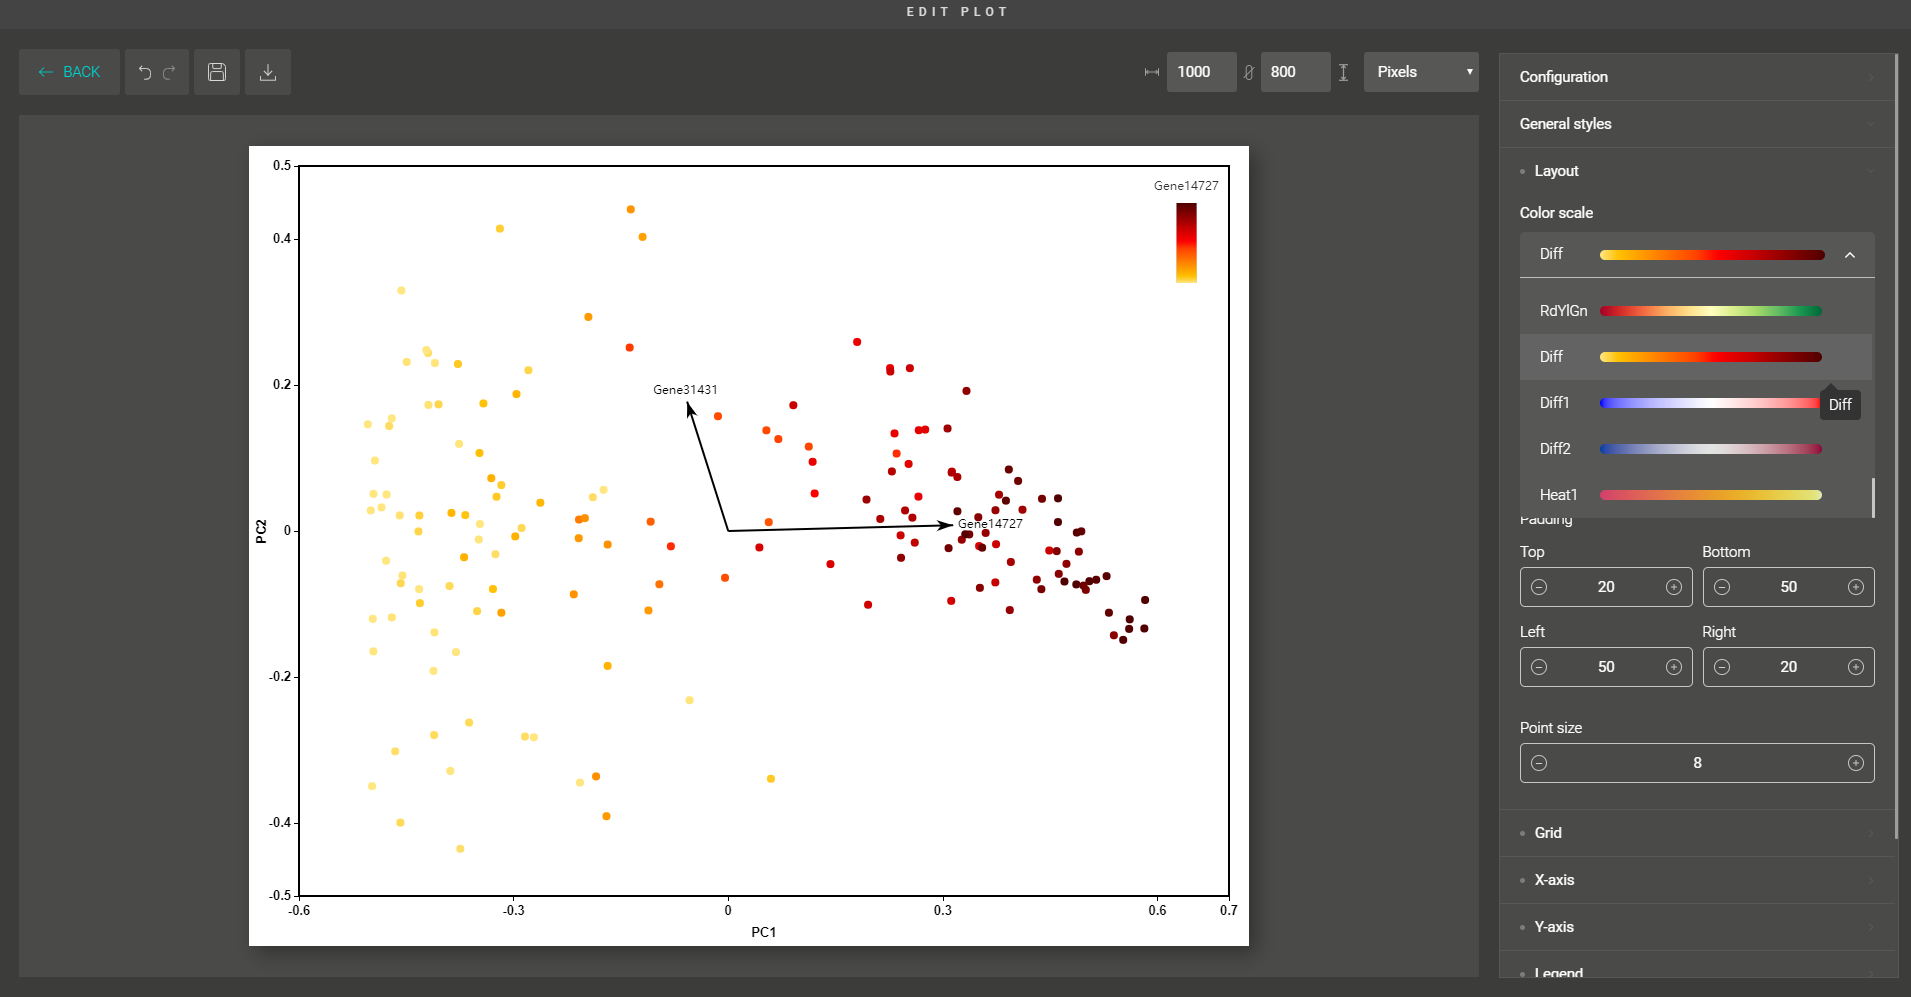
    Besides, you are supported with a variety of plot editing options to turn your dimensionality reduction results into high-quality figures for publication. From coloring, sizing, to customizing the legends, every action can be easily done by simple mouse clicks.

    Similar to Version 1.0, you can simply drag and drop to create other modern visualizations of your data. BioVinci is now available for download at https://vinci.bioturing.com

    –

    Take a look BioVinci citations [here] 
     

    PREVIOUS POST
    Single-cell analysis of CD8+ T cells in immune checkpoint blockade: some reproducible insights from BioTuring Database
    NEXT POST
    BioTuring Big Data Portal: Exploring huge public single-cell data sets without limits

    Leave a Reply Cancel reply

    Recent Posts
    • Explore 10X Visium Spatial Transcriptomics data at ease with BioTuring Browser November 9, 2020
    • A tiny world inside non-small cell lung cancer revealed by single-cell omics: 35 cell types, and their marker genes October 20, 2020
    • The Why, When and How of 3D PCA October 12, 2020
    • 6 best box and whisker plot makers September 18, 2020
    • Immunoglobulin genes up-regulated in lung adenocarcinoma infiltrating T cells: A report from BioTuring lung cancer single cell database September 8, 2020
    Categories
    • BioTuring Cellpedia
    • Data visualization and analysis
      • Box plots
      • Heatmap
      • Principal component analysis
      • Venn diagrams
      • Violin plots
    • RNA-seq data analysis
    • Single Cell Analysis
    • Single-cell RNA-seq tutorials
    • Visium Spatial Transcriptomics Analysis
    Subscribe now
    6,000,000 cells
    at ease with
    BioTuring
    Browser
    Explore now

    We are here to help

    Navigation

    About us
    Contact us
    FAQ
    Blog
    Webinar
    Video
    © 2019 BioTuring. All rights reserved