high-dimensional data visualization Archives - BioTuring's Blog
Data analysis made easy. For biologists, especially.

Tag Archives: high-dimensional data visualization

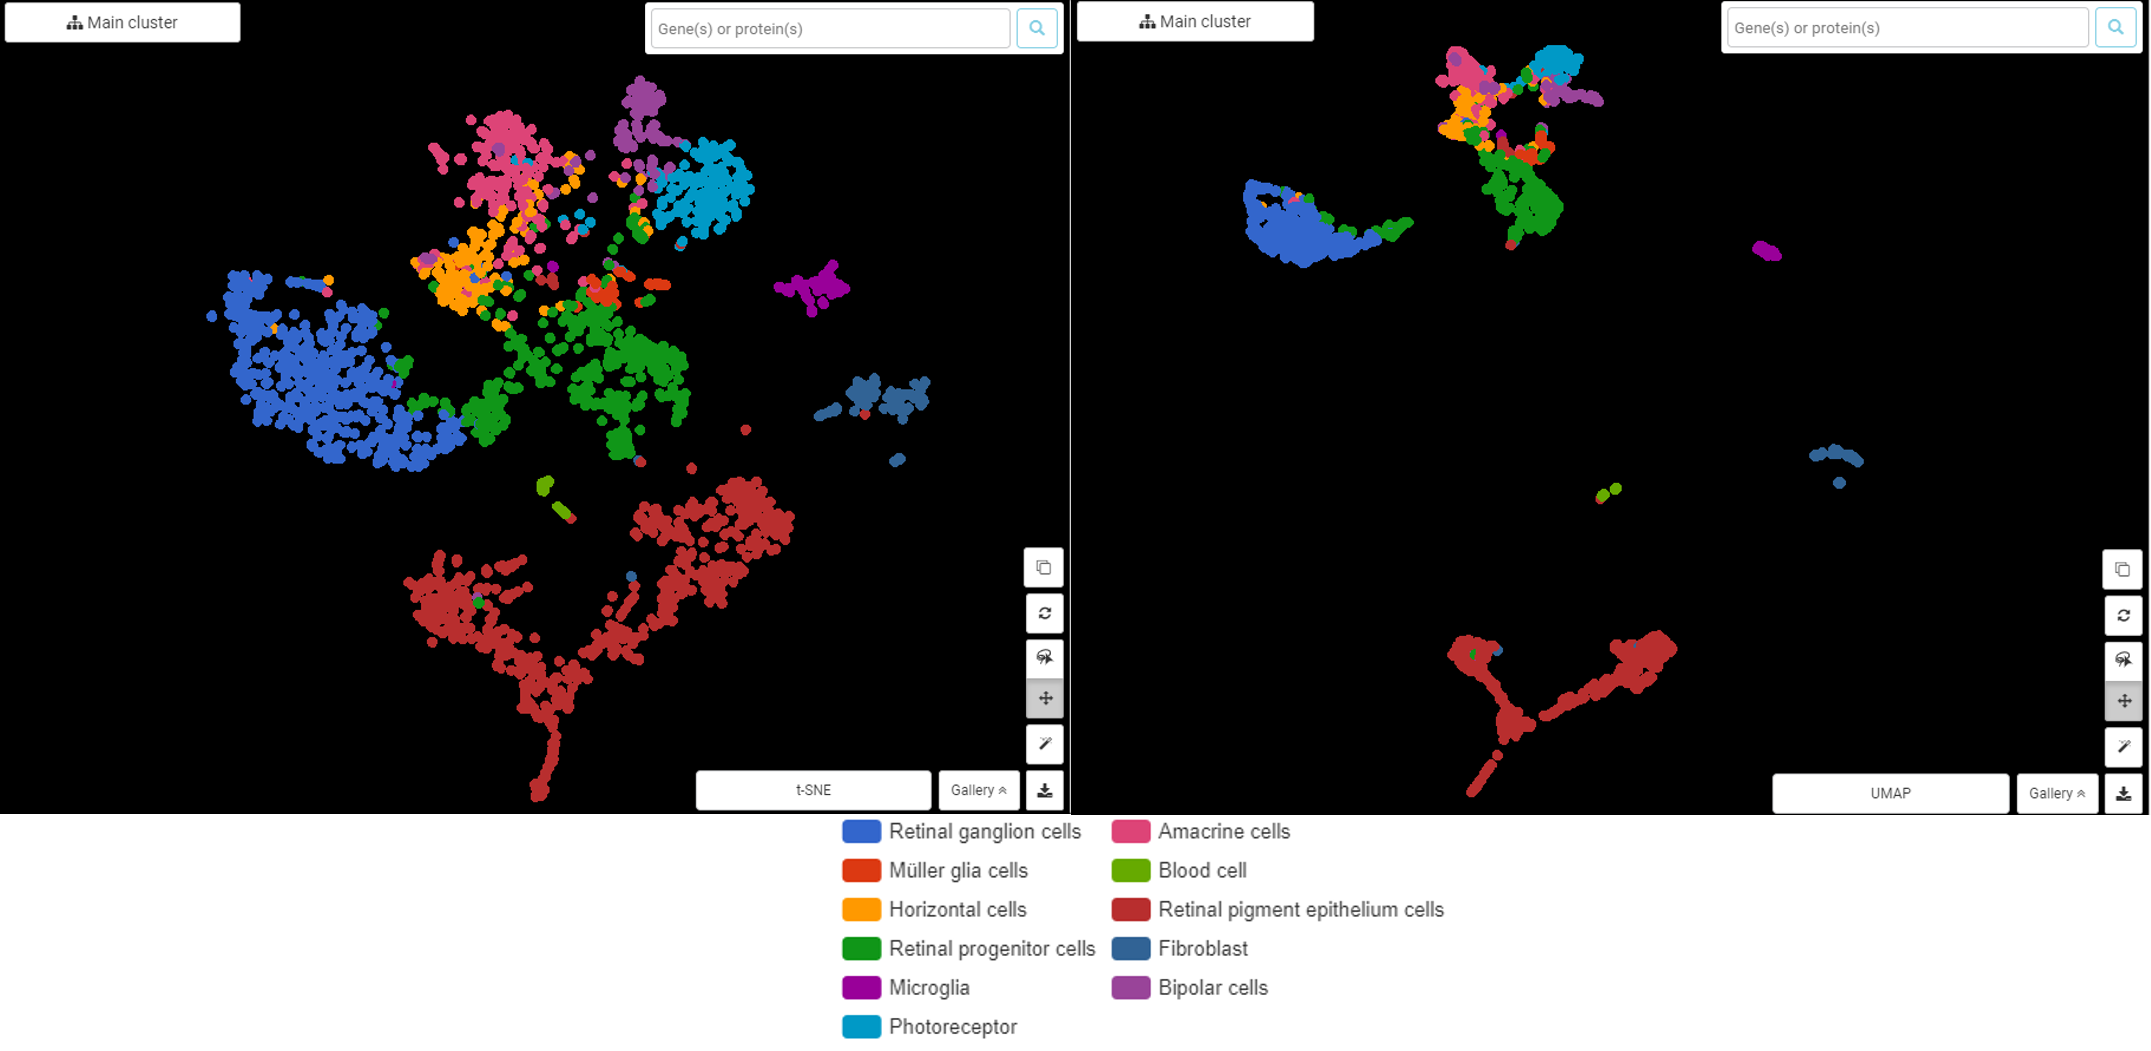
Comparing UMAP vs t-SNE in Single-cell RNA-Seq Data Visualization, Simply Explained
#
umap vs tsne global structure

How to Make Sense of Single-cell RNA Sequencing Data? Less is More Thanks to single-cell RNA sequencing (scRNA-seq), researchers are blessed with a trove of information. Yet, this blessing is also a curse in data visualization and further analysis! Since each cell is described by its gene expression profile, our […]

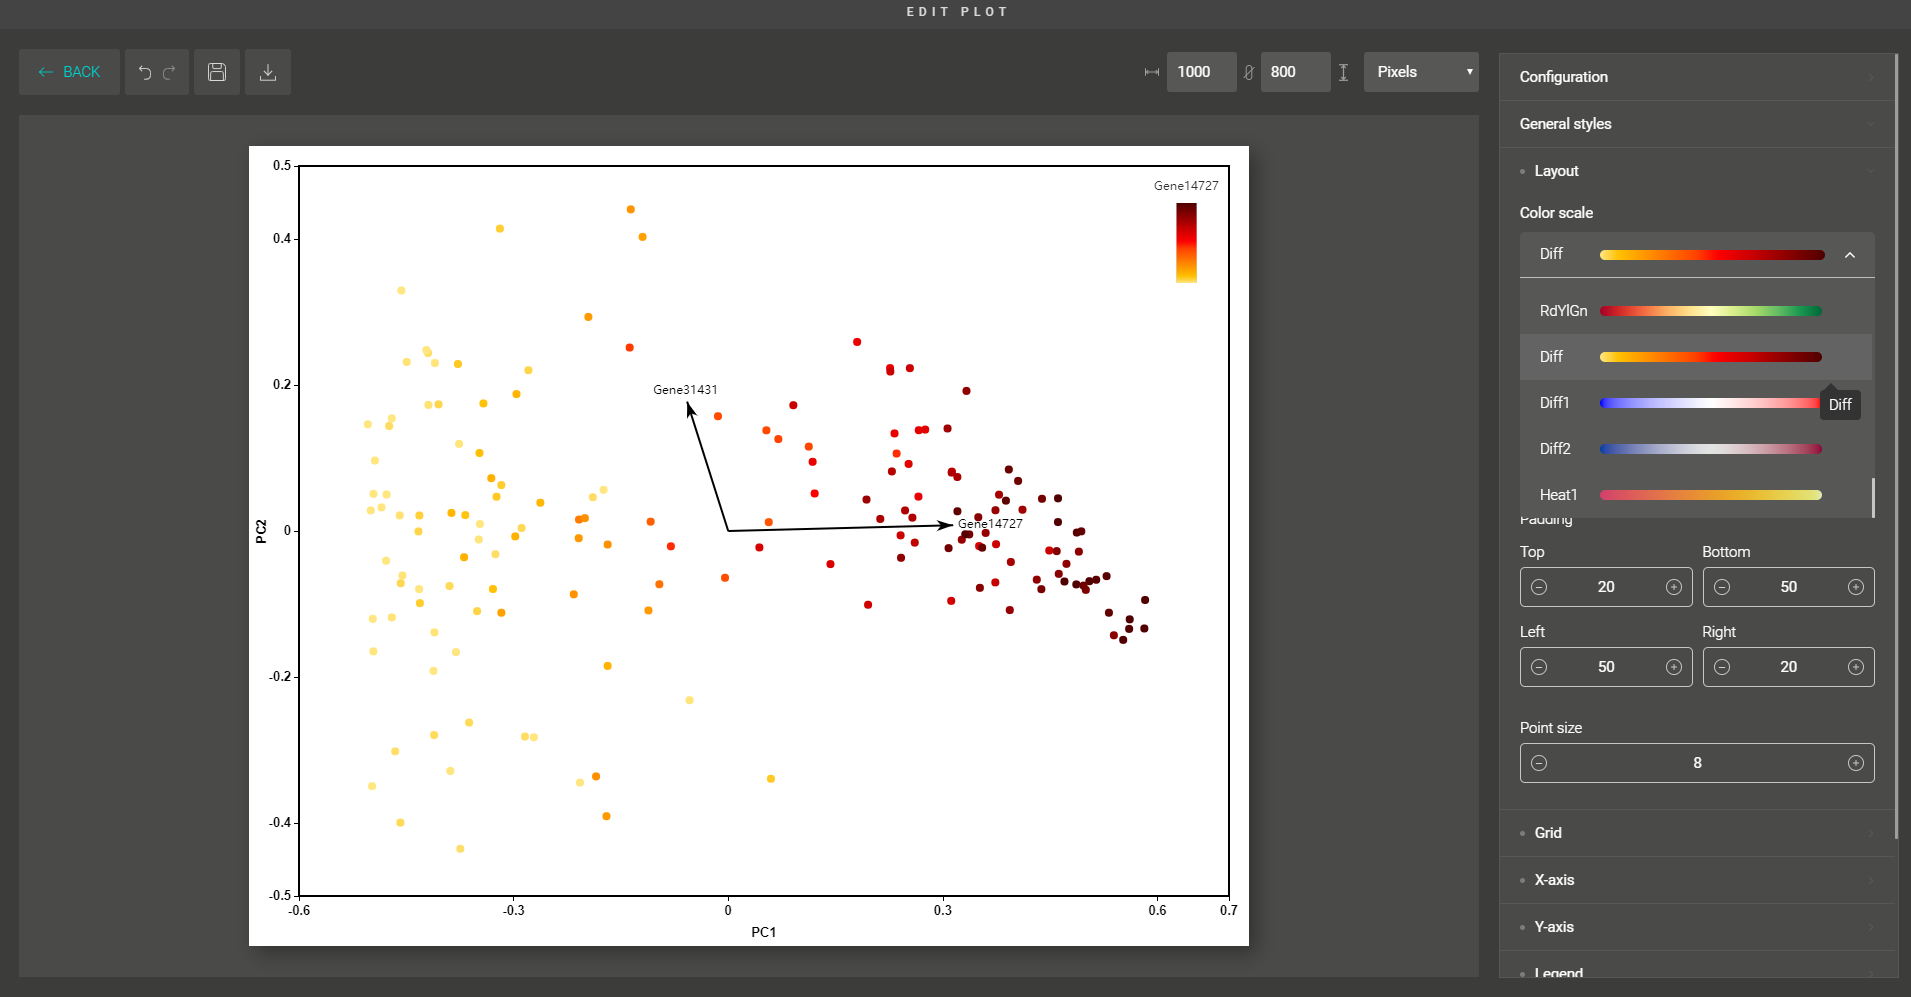
BioVinci: high-dimensional data visualization made easy for biologists
#

“How to extract the biology behind this huge matrix of thousands of rows and columns?”  Large numbers of data points hold valuable biological stories yet are tricky to graph and analyze. Imagine you had the data for 1000 features and observations, your mind would be full of questions, wondering how […]