Spatial Transcriptomics Brain Data Is In Demand
The spatial gene expression contributes significantly to brain morphology, physiology, and connectivity. However, obtaining spatial transcriptomics brain data has long been a technical challenge.
Recently, with continuous breakthroughs in spatial transcriptomics sequencing technique and data analysis tools, spatial human brain single cell RNA-Seq data has become more feasible to obtain.
Building precise spatial transcriptomics brain datasets can deepen our understanding in the brain development and disease. Earlier this year on Nature Neuroscience, Maynard and colleagues published a dataset exploring the layer-enrichment of spatial gene expression in the human dorsolateral prefrontal cortex (Maynard et al., 2021). This region is involved in several neuropsychiatric disorders, including autism spectrum disorder, schizophrenia, bipolar disorder, etc.
The study is now available in the BioTuring public database.
In this article, we’ll give you a glimpse of the essential insights from this dataset. We’ll also show you how to reproduce the same results and further, with BBrowser.
Maynard et al., 2021: Essential Insights
- What’s special about it? The first study to combine human brain single cell RNA-Seq data with spatial transcriptomics. The dataset provided an extensive spatial gene expression landscape in the dorsolateral prefrontal cortex.
- How did they do that? The authors examined postmortem brain tissues from three neurotypical adult donors. From each donor, two pairs of tissue sections were collected, the first pair is 300μm anterior from the second. Each pair is a duplicate of two adjacent sections within 10μm distance. The platform in use was 10X Visium with the average resolution of 3.3 cells per spot.
- In essence, the study provided 3 valuable insights into the spatial gene expression of the human dorsolateral prefrontal cortex:
- The differential gene expression profile across 6 gray matter layers (L1 -> L6) plus the white matter (WM), proving how single-cell sequencing data can identify the cytoarchitecture of the brain.
- Novel marker genes identified for each cortical layer.
- The layer enrichment of genes associated with some neuropsychiatric disorders, such as autism spectrum disorder (ASD) and schizophrenia (SZD).
1. Do-It-Yourself: Recreate Spatial Transcriptomics Insights with BBrowser
Users can access the study in BBrowser by searching for the article name or query the study ID (spatial_libd_2021) in the Home page. Once open, users can choose to view clusters in either t-SNE plot or multiple spatial slides. The multiple spatial slides coordinate allows users to explore single-cell sequencing data and histological tissue sections simultaneously (Figure 1).
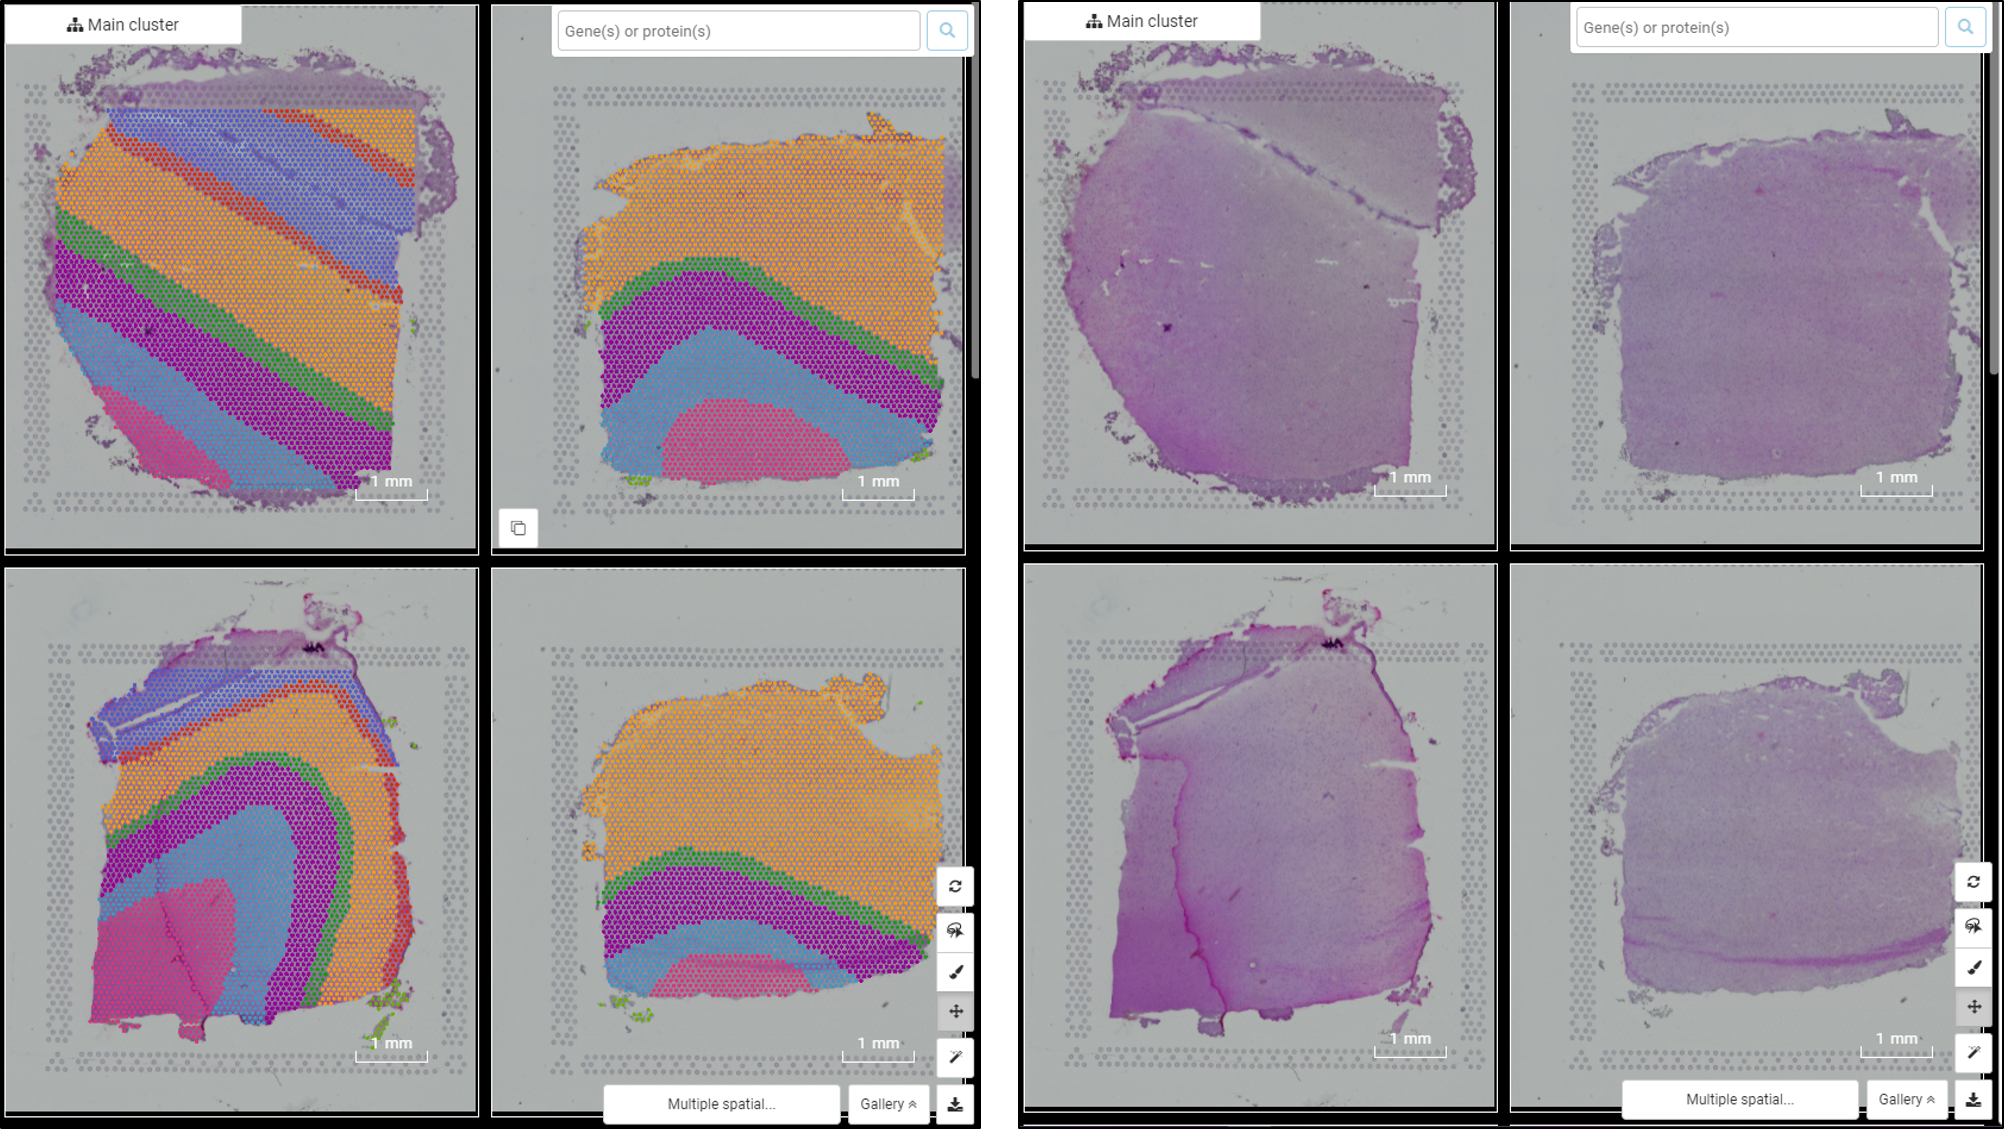
Figure 1. Multiple spatial slides from Maynard et al. (2021) visualized in BBrowser with the image of histological tissue section (right) and the spots overlayed on top of the image (left)
1.1 Verify layer-specific markers and reconstruct the prefrontal cortex cytoarchitecture
In the study, by comparing known marker gene sets plus hierarchical clustering single cell sequencing data, the authors could identify the cortex cytoarchitecture. Moreover, they verified canonical layer markers and recognized several novel specific marker genes.
With the Marker features function in BBrowser, we attempted to recreate the results. For each layer, the analysis produced a list of marker genes that sets it apart from the rest. We then refined these lists by removing overlapping genes (e.g ENC1, CCK, MBP, etc.). The final list of marker genes helped us define Layer 3, Layer 1, and the WM.
We then sought further to separate layers from Layer 2 to 6. Unfortunately, their very similar gene expression profiles prohibited our attemtps. We summarized top markers for each layer and how their expression helped us generally define the cytoarchitecture of the prefrontal cortex in Figure 2.
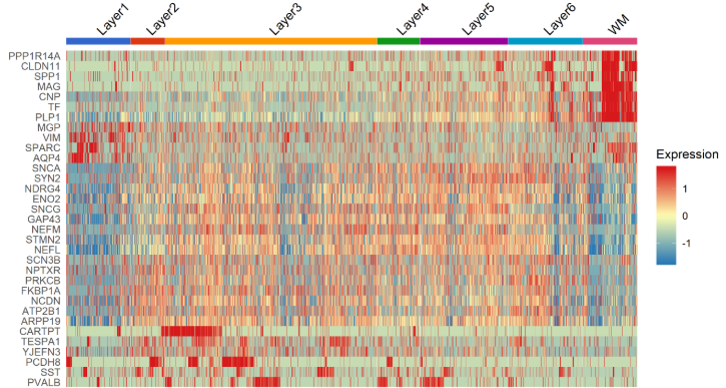
Figure 2. Heatmap (single-cell) of top marker features found by BBrowser for each layer, showing a distinction of Layer 3, Layer 1, and the WM with the rest
Regarding the paper’s suggested novel markers, which are AQP4 (L1), HPCAL1 (L2), FREM3 (L3), TRABD2A (L5) and KRT17 (L6), our results slightly disagree. While AQP4, HPCAL1, and KRT17 are indeed specific to Layer 1, 2 and 6, respectively (Figure 3), other marker genes are not as powerful. The spatial gene expression of FREM3 (in Layer 3) and TRABD2A (in Layer 5) are not clearly different from that in other layers (Figure 4).
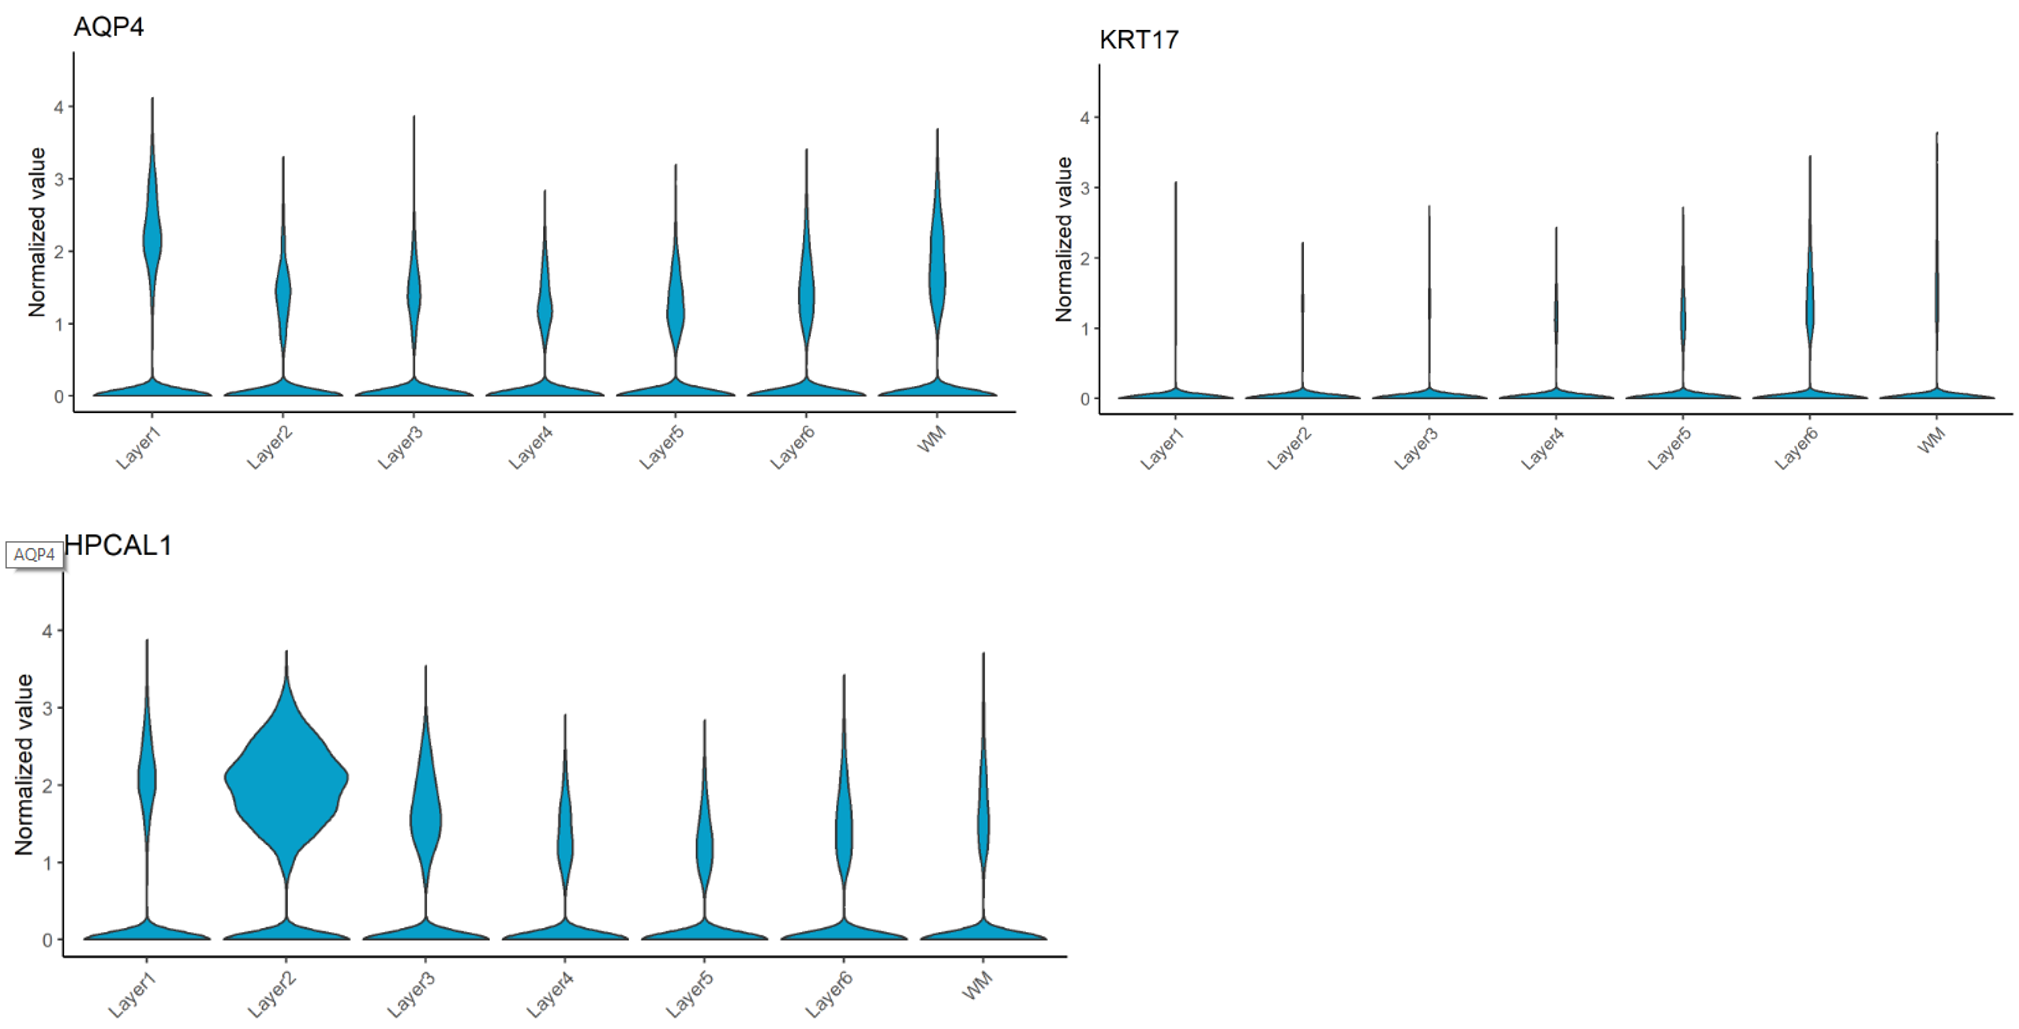
Figure 3. Violin plot for AQP4 (L1), HPCAL1 (L2), and KRT17 (L6) spatial gene expression across 6 layers and WM
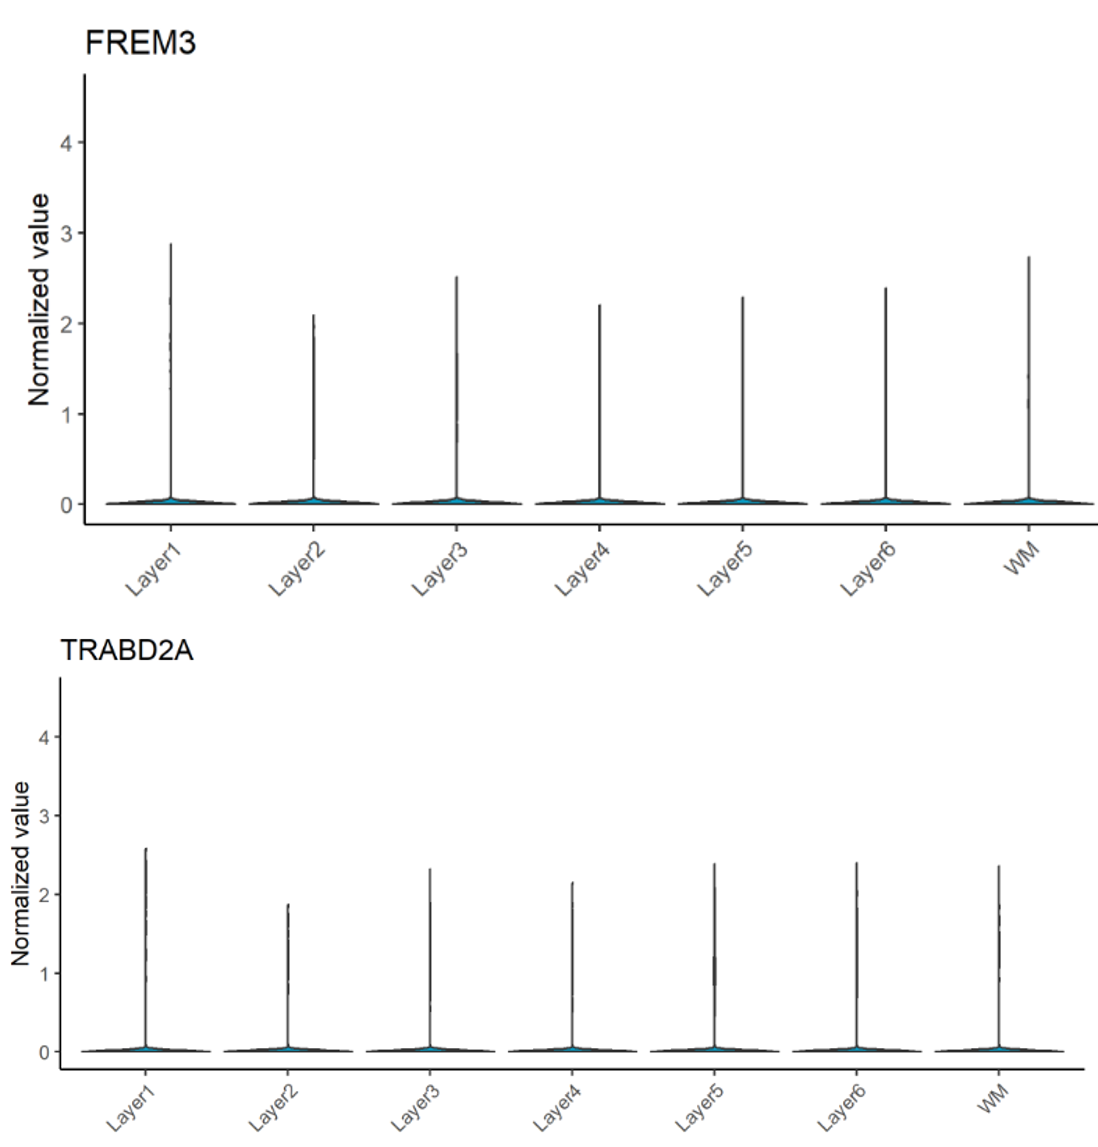
Figure 4. Violin plot for FREM3 (L3) and TRABD2A (L5) spatial gene expression across 6 layers and WM
1.2. Study brain disorder-associated gene sets in the context of spatial transcriptomics
In the study, an ASD-associated gene set (ASC102), provided by Satterstrom et al. (2020), was found to be enriched in Layer 2, 3, 4, 5, and 6. Among them, 53 predominantly ASD genes (gene set ASD53) were enriched in L2 and 49 predominantly developmental delay genes (gene set DDID49) were enriched in Layer 5.
The result from BBrowser is in agreement with what Maynard et al reported. We first used the Multiple gene query function, which allows an infinite number of gene query, to search for cells that highly express ASD-associated genes. We then applied Composition analysis on this population.
Our result showed that ASD-related genes are enriched in 5 layers from Layer 2 to 6 (Figure 5). The gene sets for ASD dominant traits are more enriched for Layer 5 (Figure 6) while genes related to neurodevelopmental delay are more enriched for Layer 2 (Figure 7).
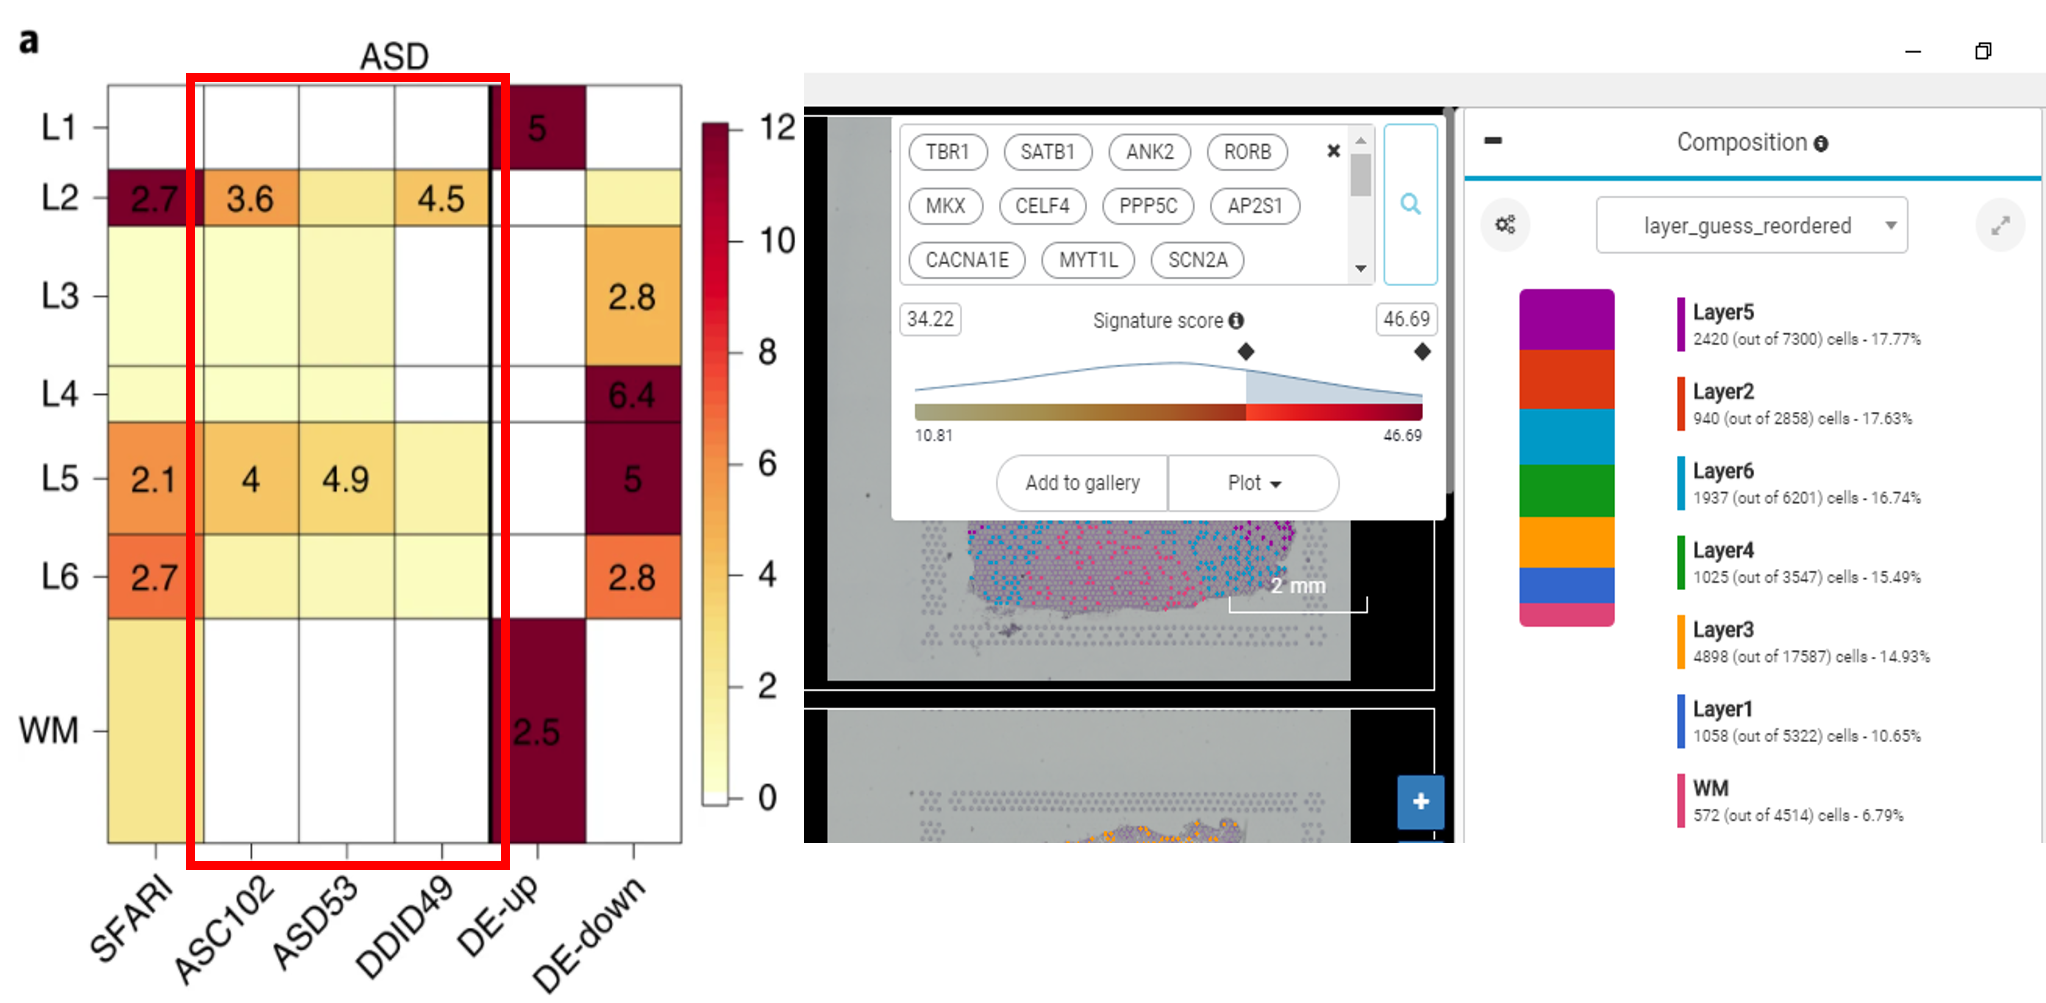
Figure 5. Cells with high expression of ASD-related genes accumulate in 5 layers from Layer 2 to Layer 6, results from Maynard et al. (left) and from BBrowser (right)
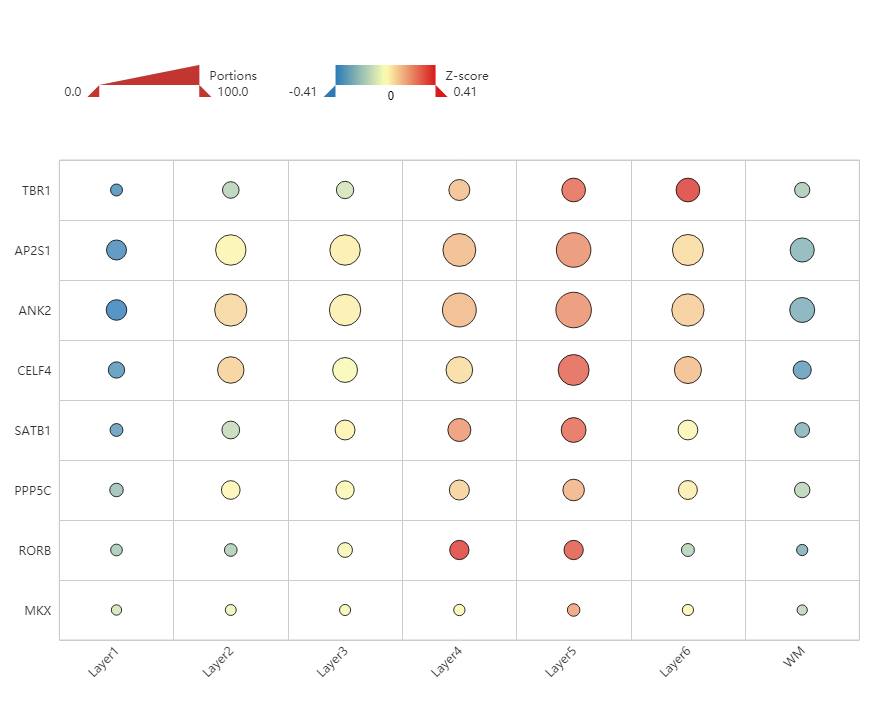
Figure 6. Heatmap of genes associated with ASD dominant traits, showing enrichment in Layer 5
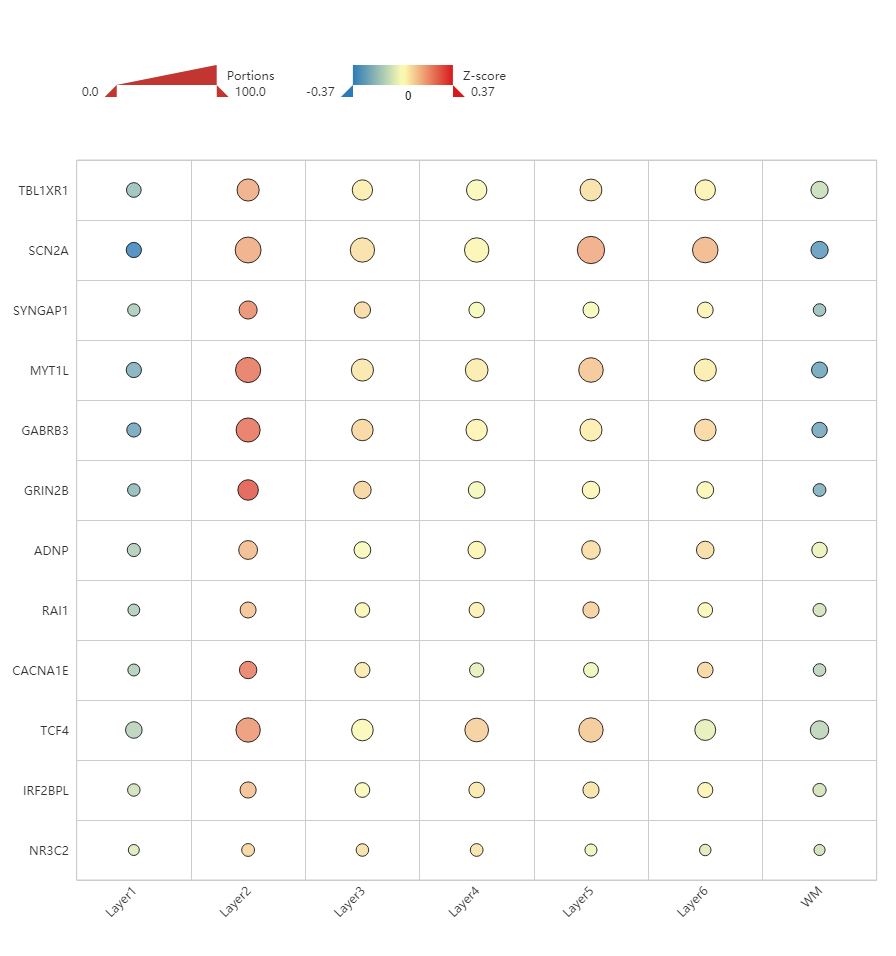
Figure 7. Heatmap of genes associated with neurodevelopmental delay, showing enrichment in Layer 2
2. Use BBrowser Spatial Signatures to find genes that share spatial expression patterns
Spatial Signature is a brand new analysis in the BBrowser toolkit for spatial transcriptomics exploration. This feature helps researchers identify spatially variable genes, group them into patterns, and obtain new biological insights.
We applied Spatial Signatures on all 12 slides and found some groups of genes that exhibit consistent spatial expression patterns across different slides. Some notable patterns are mentioned below.
2.1. MT-CO1, MT-CYB, MT-ND5, MT-ND4L, CAMK2N1, HPCAL1, HOPX, SERPINE2, PCDH8: highly accumulated in Layer 1 and the border of gray/white matter
Across the slides, we found that a group of mitochondrial genes (MT-CO1, MT-CYB, MT-ND5, MT-ND4L, etc.), which involved in cellular respiratory activities, frequently shared a similar spatial expression pattern with CAMK2N1, HPCAL1, HOPX, SERPINE2, PCDH8 i.e. genes of different biological processes. In particular, CAMK2N1 and HPCAL1 take part in calcium-dependent signaling pathways, while HOPX, SERPINE2, and PCDH8 are associated with varied developmental processes. Their shared spatial expression pattern is being highly accumulated in Layer 1 and the border of gray/white matter (Figure 8).
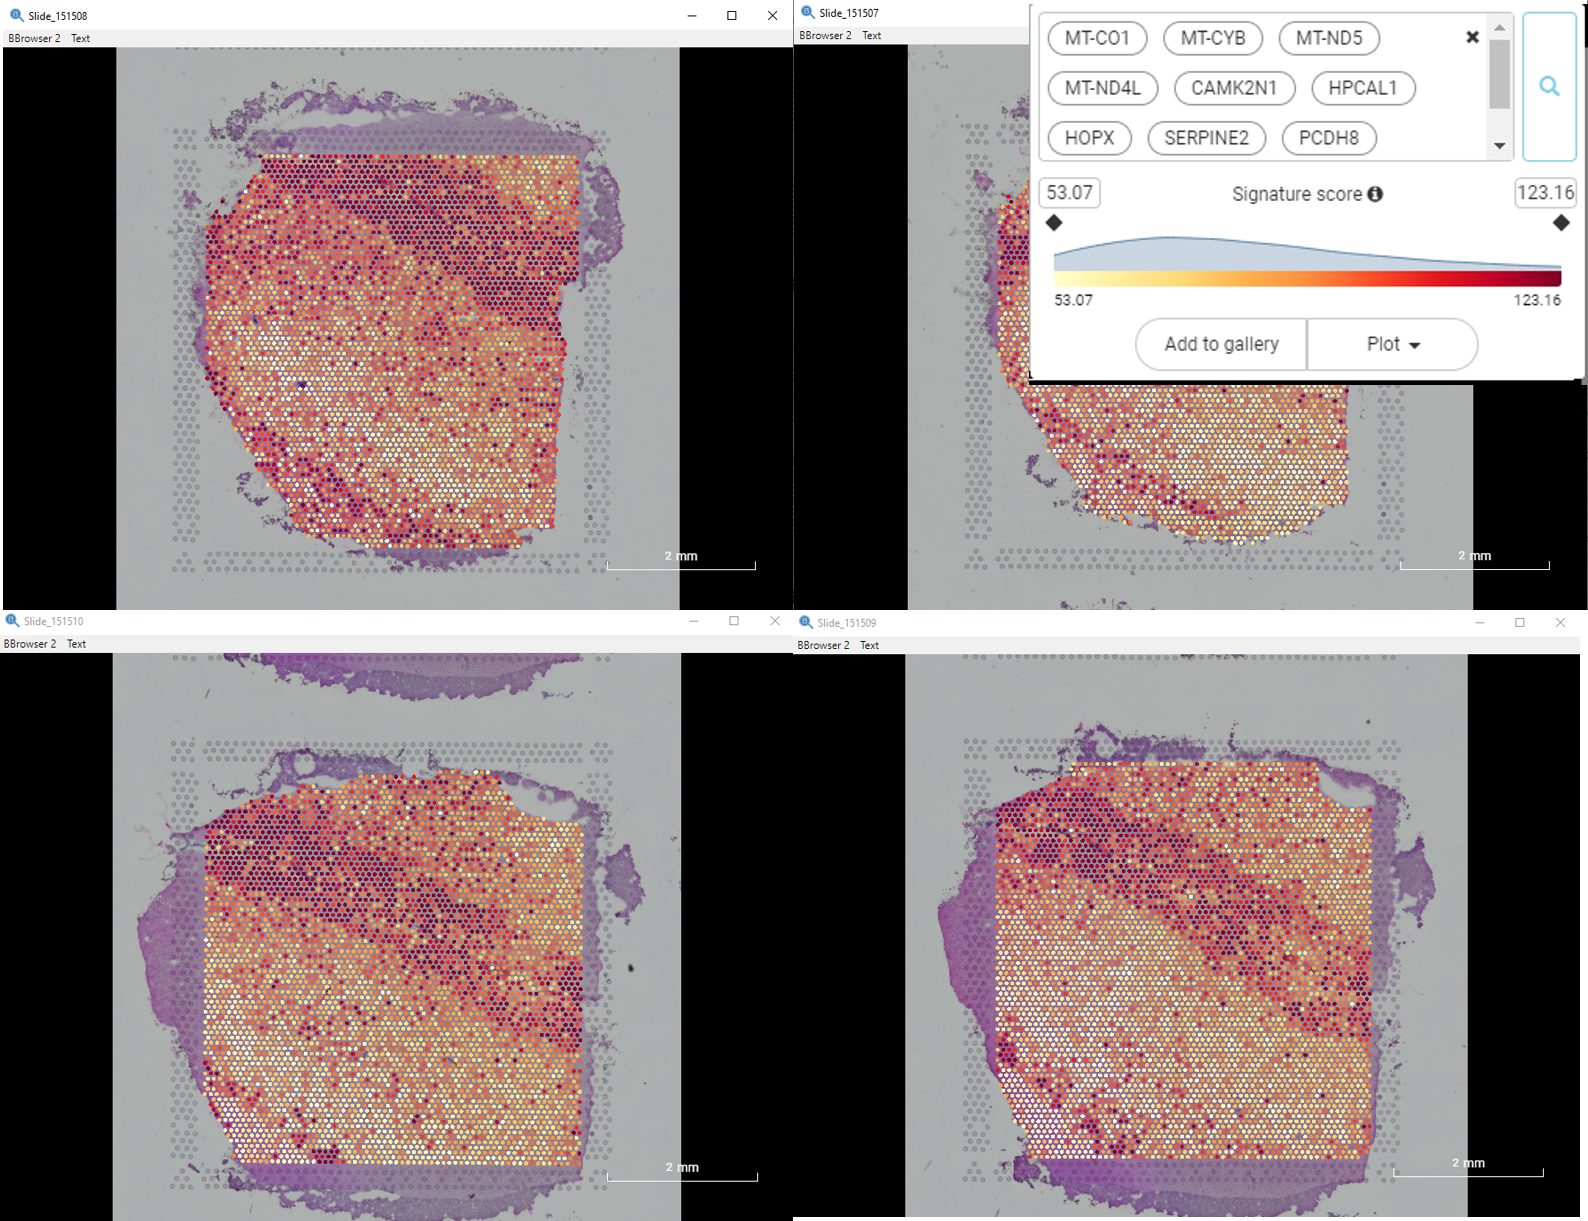
Figure 8. The spatial gene expression pattern shared by MT-CO1, MT-CYB, MT-ND5, MT-ND4L, CAMK2N1, HPCAL1, HOPX, SERPINE2, and PCDH8 across slides, showing the accumulation in Layer 1 and the border of gray/white matter
Layer 1 is mostly known for early brain development but much of its function in adult brains is lesser understood. So far, researchers have worked out that Layer 1 is the mediator of neural inputs into deeper layers. In this context, the high expression of CAMK2N1 and HPCAL1 can be explained by the busy Ca2+ activity in Layer 1’s neural circuits. However, strong developmental processes and cellular respiratory activities are rarely mentioned in the characterization of adult neocortical Layer 1.
2.2. MBP, PLP1, MOBP, TF, SEPTIN4: highly accumulated in the white matter
This result is explicable by the domination of oligodendrocyte in the white matter, as most of them are associated with the formation of the myelin sheath (MBP, PLP1, MOBP). In this group, the appearance of TF and SEPTIN4 is quite interesting at the first glance, as the former encodes transferrin-an iron transporter, while the latter is a regulator of cell division and cell death.
Our observation of TF and SEPTIN4 high correlation with oligodendrocyte-specific genes turns out to fit well with the studies of Jahanshad et al. (2012) and Patziget et al. (2016). Jahanshad et al. found that transferrin, through maintaining iron homeostasis, can influence the macro- and microstructure of the living brain, in particular, the white matter fiber integrity. Meanwhile, Patziget al. concluded that the product of SEPTIN4 and other members of its family are critical in scaffolding the axon/myelin-unit, without which myelin maturation is impaired.
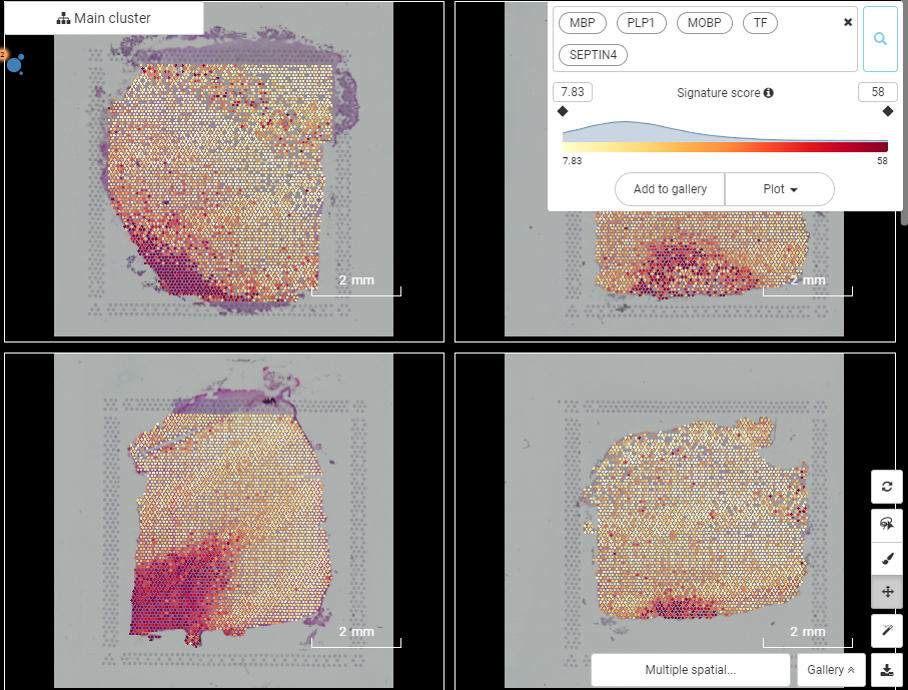
Figure 9. The spatial gene expression pattern shared by MBP, PLP1, MOBP, TF, and SEPTIN4 across slides showing the accumulation in the white matter
2.3. GFAP, S100B, SNORC, SPARC, AQP4, FABP7, MT1G: highly expressed in Layer 1 and white matter
Again, the pattern can be nicely explained by the presence of astrocytes in these two layers. The majority of genes in this pattern are related to astrocytosis or astrocyte’s components (GFAP, S100B, AQP4, FABP7).
The other three genes (SNORC, SPARC, and MT1G) are functionally unrelated to astrocytes, but their expressions have been found to be impactful to brain activity, one way or another. SNORC can influence brain methylation and this impact is associated with attention-deficit/hyperactivity disorder (Pineda-Cirera et al., 2019), SPARC regulates the maturation and migration of cortical interneurons (Genestine et al., 2021). The last one, MT1G, remains a mystery, but its high expression is known to be associated with malignant astrocytomas (Masiulionytė et al., 2019).
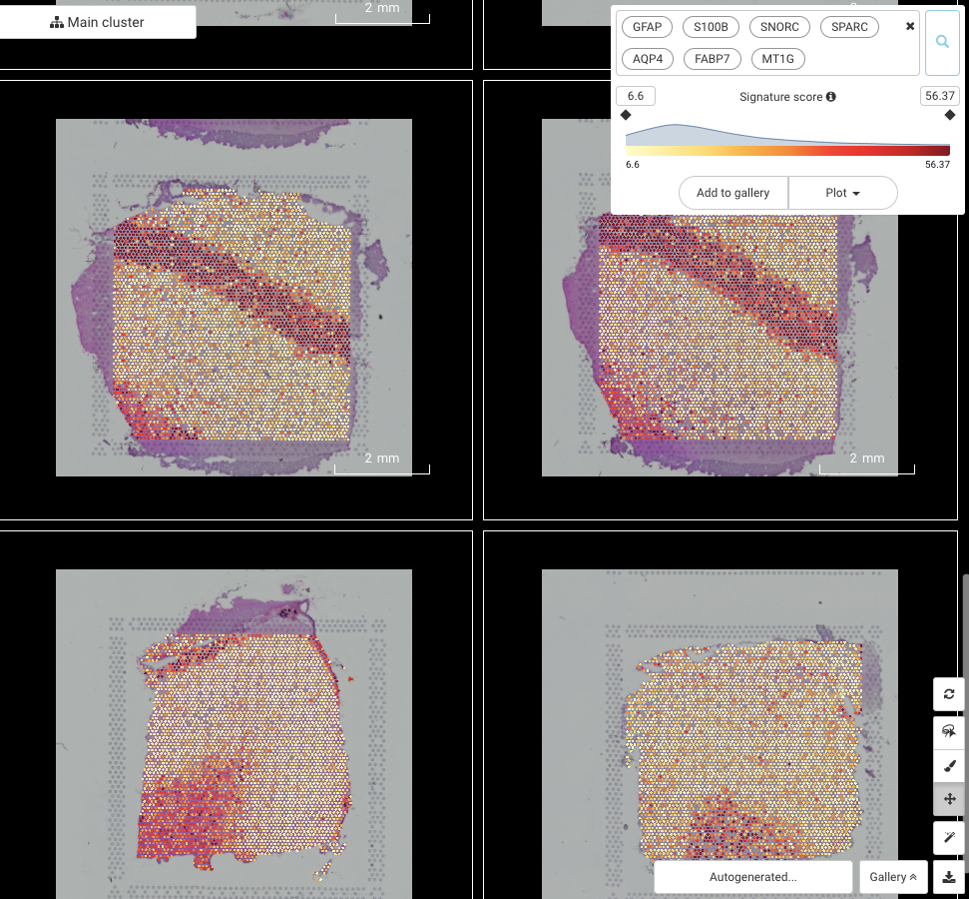
Figure 10. The spatial gene expression pattern shared by GFAP, S100B, SNORC, SPARC, AQP4, FABP7, and MT1G across slides showing the accumulation in the white matter
What can be the biological meaning behind these patterns? The answer is beyond the scope of this article, and we would like to leave the door open for our readers’ curiosity. Share your thoughts with us in the comments!
Closing
Current technological advances conveniently combine human brain single cell RNA-Seq and spatial transcriptomics brain tissue section. This combination has opened new avenues for dissecting the complex cytoarchitecture of the neural system. With BBrowser, making sense of spatial transcriptomics brain data is even more feasible.
In this article, we recapped 3 essential insights from Maynard et al., (2021) – a comprehensive spatial transcriptomics brain dataset. Our examples showed how you can recreate these interesting insights at ease. The results are not only informative for readers who want to understand this brain region better, but also suggestive for potential discovery.
The dots are ready to be connected. Now it’s your turn! For a visual tutorial, check out our video and gain hands-on experience with BBrowser. For explorers, more spatial datasets await you in our BioTuring public database.
Reference:
- Maynard, K. R., Collado-Torres, L., Weber, L. M., Uytingco, C., Barry, B. K., Williams, S. R., … & Jaffe, A. E. (2021). Transcriptome-scale spatial gene expression in the human dorsolateral prefrontal cortex. Nature neuroscience, 24(3), 425-436.
- Satterstrom, F. K., Kosmicki, J. A., Wang, J., Breen, M. S., De Rubeis, S., An, J. Y., … & Demontis, D. (2020). Large-scale exome sequencing study implicates both developmental and functional changes in the neurobiology of autism. Cell, 180(3), 568-584.
- Jahanshad, N., Kohannim, O., Hibar, D. P., Stein, J. L., McMahon, K. L., de Zubicaray, G. I., … & Thompson, P. M. (2012). Brain structure in healthy adults is related to serum transferrin and the H63D polymorphism in the HFE gene. Proceedings of the National Academy of Sciences, 109(14), E851-E859.
- Patzig, J., Erwig, M. S., Tenzer, S., Kusch, K., Dibaj, P., Möbius, W., … & Werner, H. B. (2016). Septin/anillin filaments scaffold central nervous system myelin to accelerate nerve conduction. Elife, 5, e17119.
- Pineda-Cirera, L., Shivalikanjli, A., Cabana-Domínguez, J., Demontis, D., Rajagopal, V. M., Børglum, A. D., … & Fernàndez-Castillo, N. (2019). Exploring genetic variation that influences brain methylation in attention-deficit/hyperactivity disorder. Translational psychiatry, 9(1), 1-11.
- Genestine, M., Ambriz, D., Crabtree, G. W., Dummer, P., Molotkova, A., Quintero, M., … & Au, E. (2021). Vascular-derived SPARC and SerpinE1 regulate interneuron tangential migration and accelerate functional maturation of human stem cell-derived interneurons. Elife, 10, e56063.
- Masiulionytė, B., Valiulytė, I., Tamašauskas, A., & Skiriutė, D. (2019). Metallothionein genes are highly expressed in malignant astrocytomas and associated with patient survival. Scientific reports, 9(1), 1-7.