Minh-Hien Tran, Author at BioTuring's Blog
Data analysis made easy. For biologists, especially.

Author Archives: Minh-Hien Tran

The Art of Setting Single-cell Quality Control Parameters
#
single cell qc Picture1

Performing single-cell quality control is a vital step in the data analysis pipeline. Setting QC parameters can significantly affect downstream analysis: too permissive QC filtering makes the dataset too noisy to read, and too stringent QC thresholds may remove important information.  In this article, let’s discuss the art of setting […]

Explore NanoString GeoMx DSP Spatial Transcriptomics with BBrowser
#
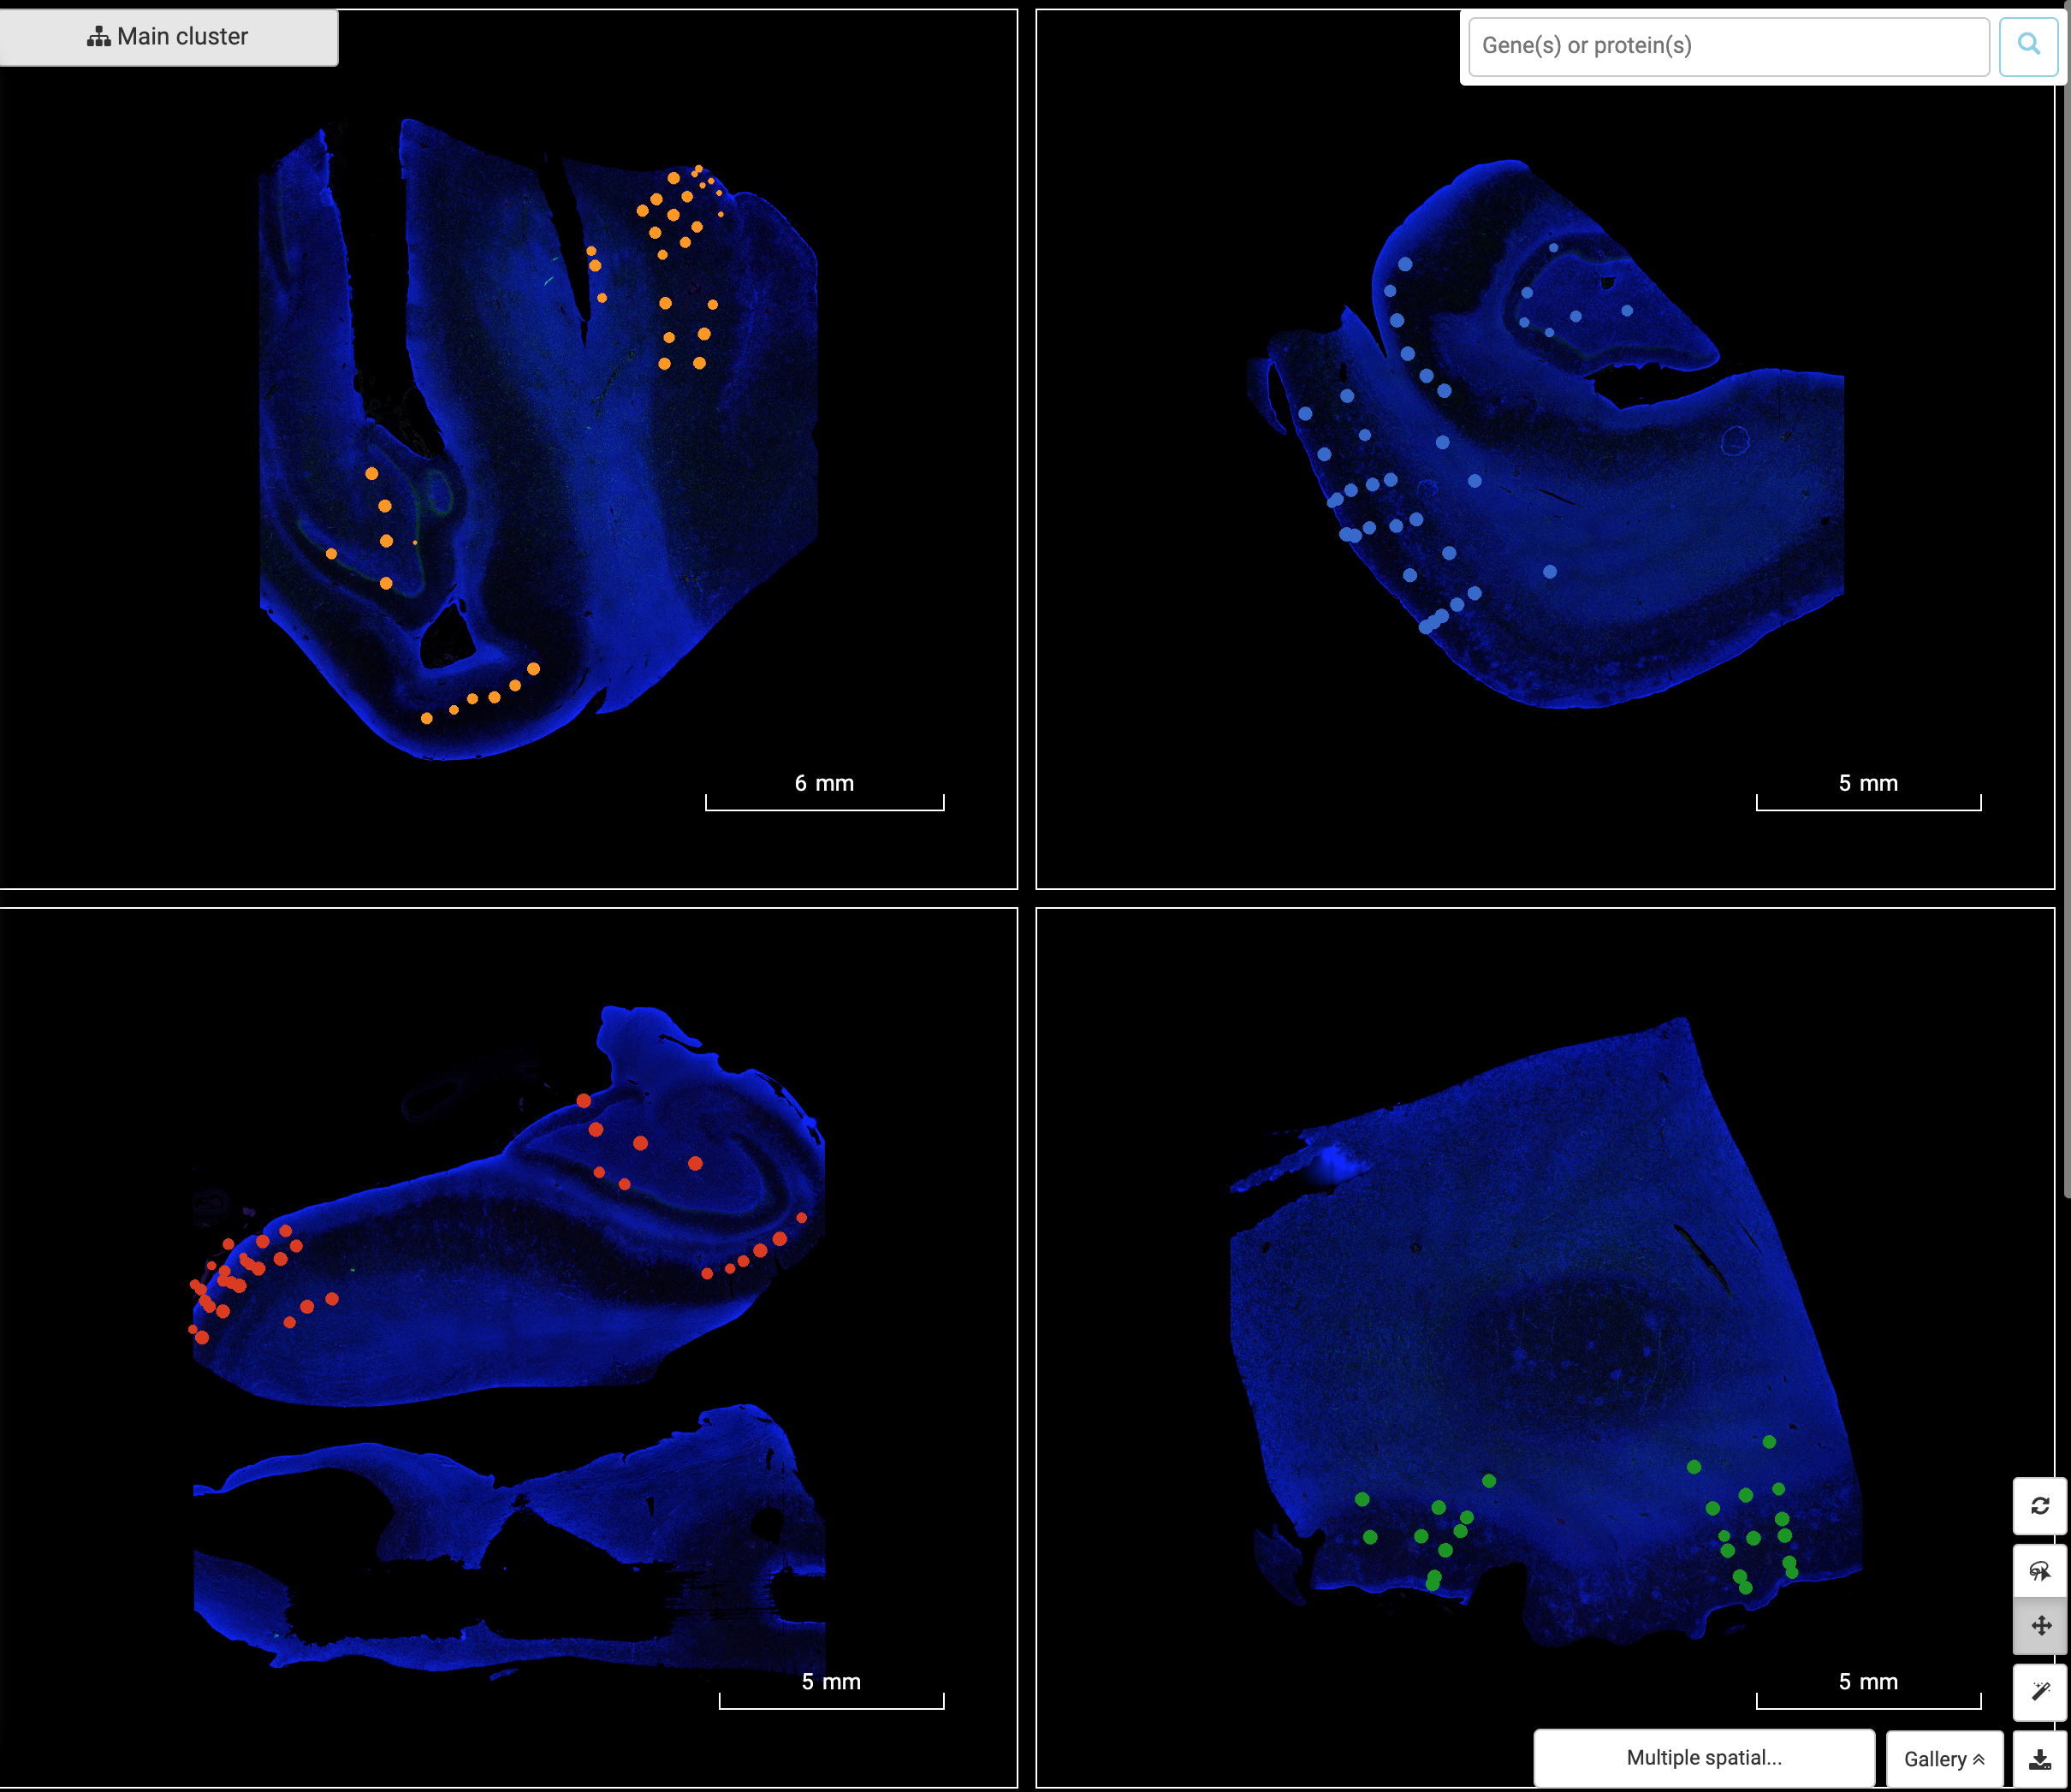
nanostring geomx dsp view multi slide

From Single-cell RNA-sequencing to Spatial RNA-sequencing Since its invention, single-cell RNA-sequencing has become one of the most popular genomic tools. Despite its power in dissecting the transcriptome at individual cell resolution, single-cell RNA-sequencing stil faces several limitations. One of them is the lack of critical spatial information. Adding spatial context […]

Single-cell RNA-Seq Trajectory Analysis Review
#
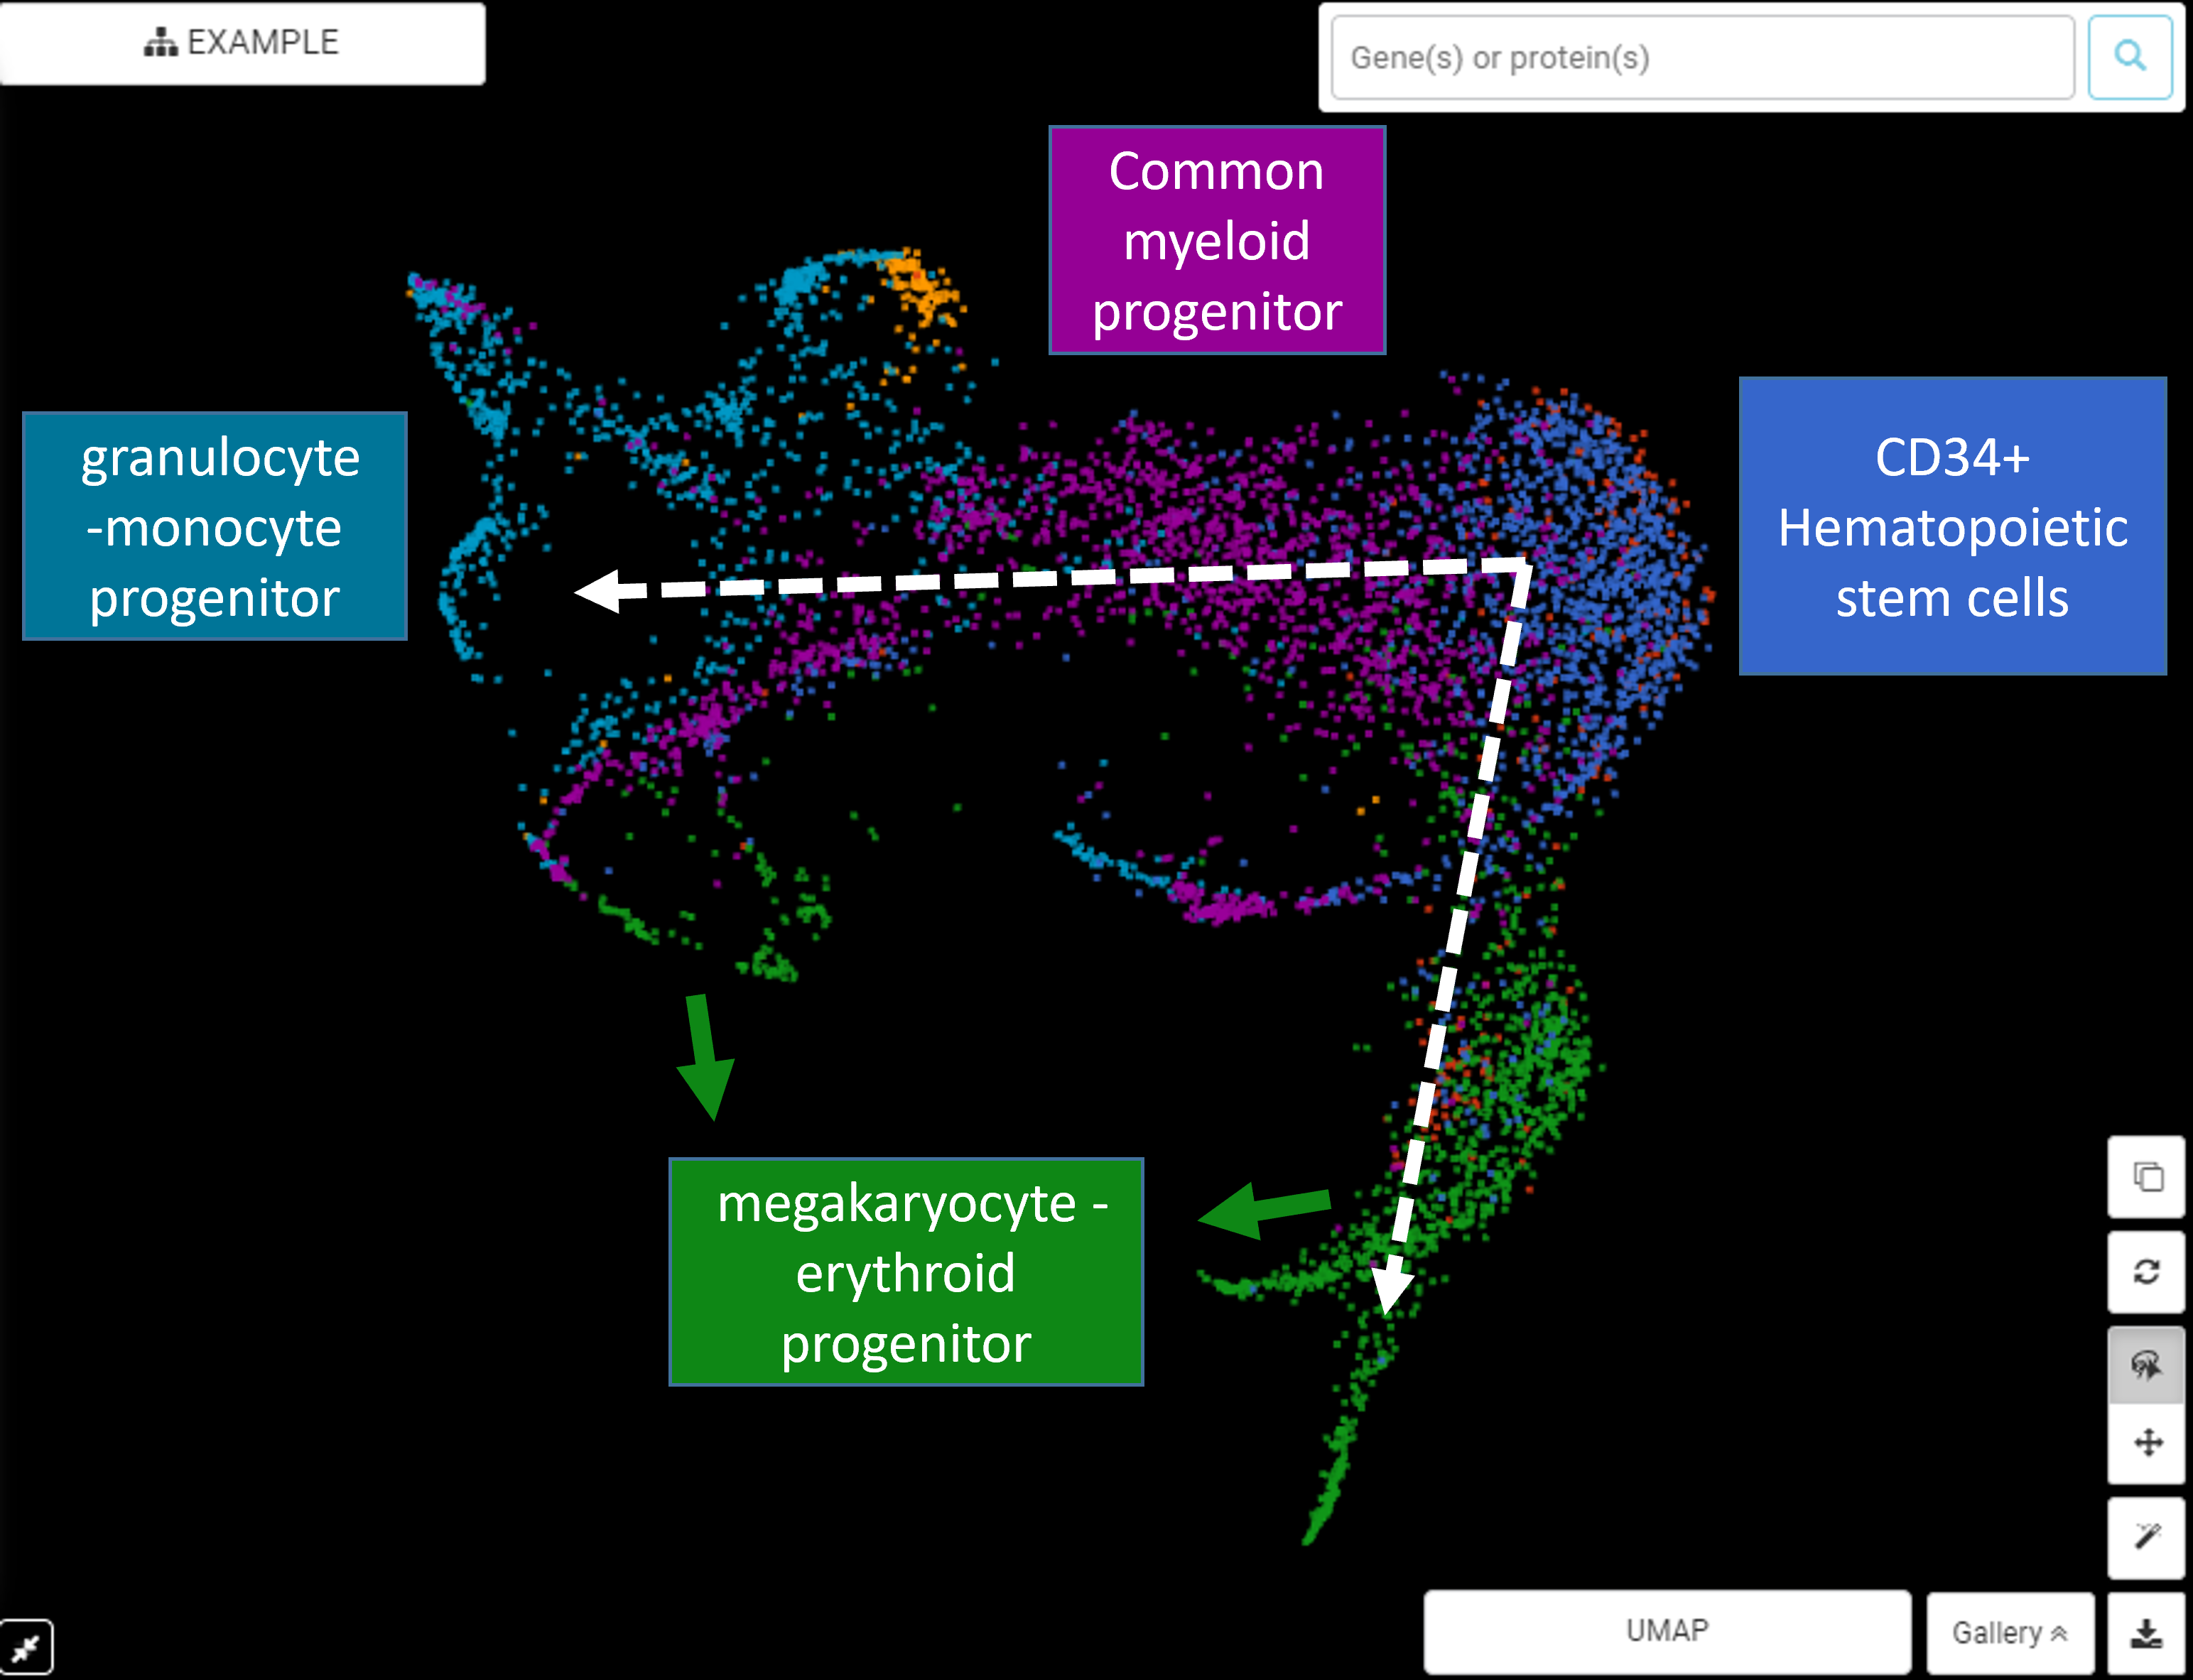
trajectory analysis umap 1

Cellular state often exists in a continuum rather than distinct phases. A prime example is cell development and differentiation. With single-cell RNA-Seq, researchers can observe this continuum of transcriptomic changes via analysis of individual cells. The need to computationally model these dynamics leads to the birth of single-cell RNA-seq trajectory […]

The Basics of DESeq2 – A Powerful Tool in Differential Expression Analysis for Single-cell RNA-Seq
#
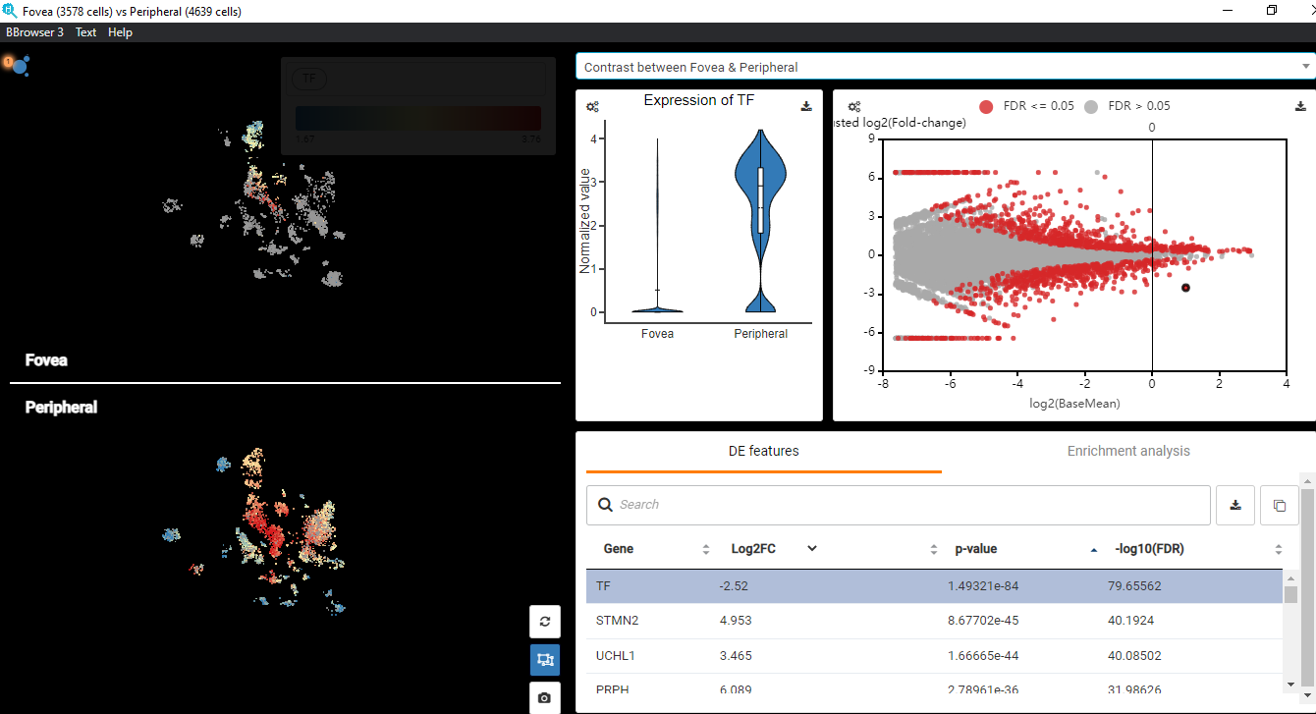
deseq2 single cell example

Differential expression analysis is a common step in a Single-cell RNA-Seq data analysis workflow. In our previous post, we have given an overview of differential expression analysis tools in single-cell RNA-Seq. This time, we’d like to discuss a frequently used tool – DESeq2 (Love, Huber, & Anders, 2014).  According to […]

BioTuring Data Science Platform: A Jupyter notebook library of latest methods for single-cell analysis in R and Python
#
r single cell analysis bioturingdatascienceplatform

Did you know that by the end of 2021, the number of tools for single-cell RNA-sequencing (scRNA-seq) data analysis has passed 1,000? (Zappia and Theis, 2021) This massive resource accelerates the exploration of single-cell data. At the same time, the plethora of options poses several challenges for researchers, such as:   […]

The Maze of Differential Gene Expression Analysis in Single-cell RNA-Seq
#
scrna seq differential expression - venice

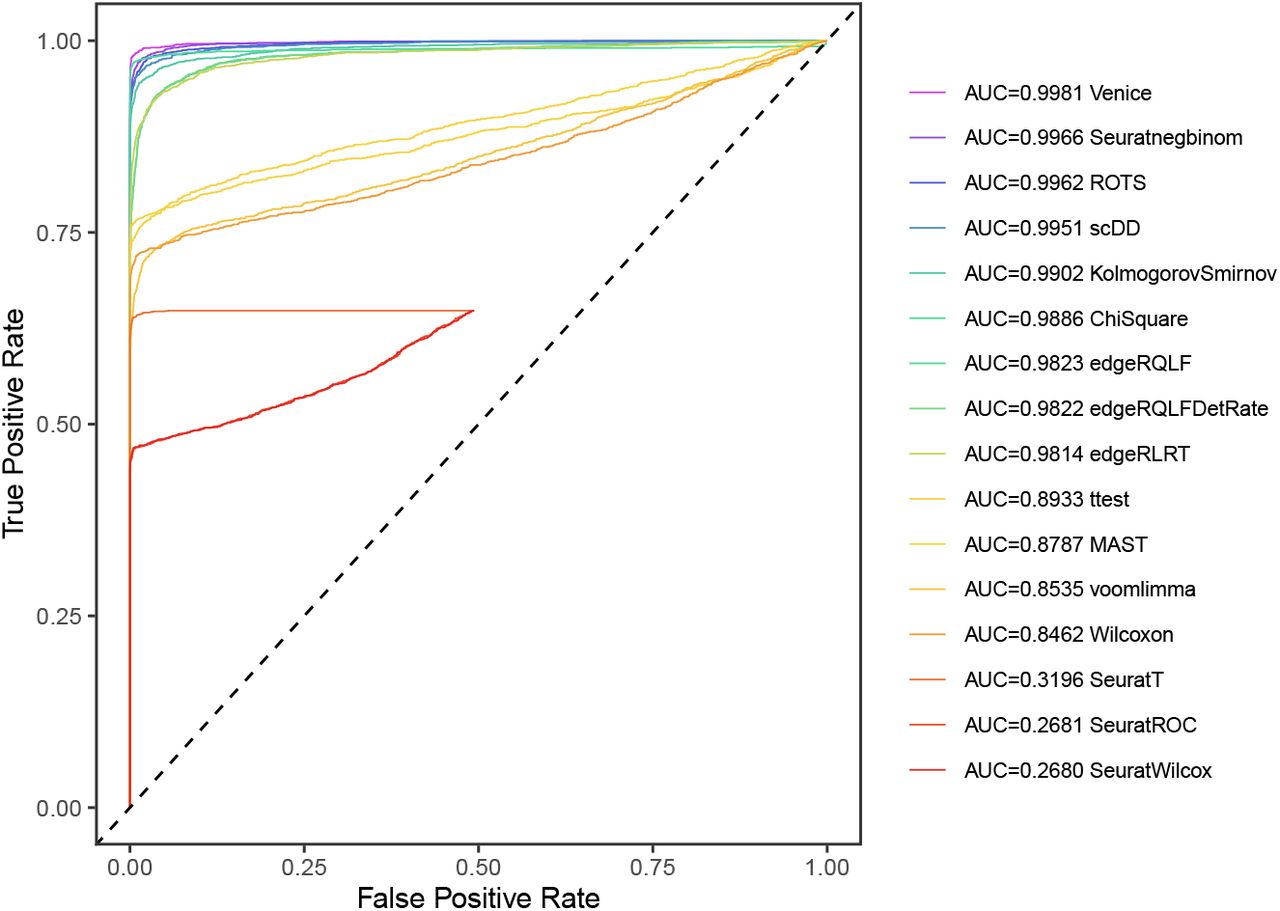
Single-cell RNA sequencing (scRNA-seq) unfolds biological processes at individual cell resolution. One key step that makes up the power of scRNA-seq is the spotting of differentially expressed (DE) genes. However, characteristics like high heterogeneity and data sparsity (high zero counts) are the main obstacles in finding DE genes in scRNA-seq […]

Batch Effect in Single-Cell RNA-Seq: Frequently Asked Questions and Answers
#
batch effect single cell rna seq 2

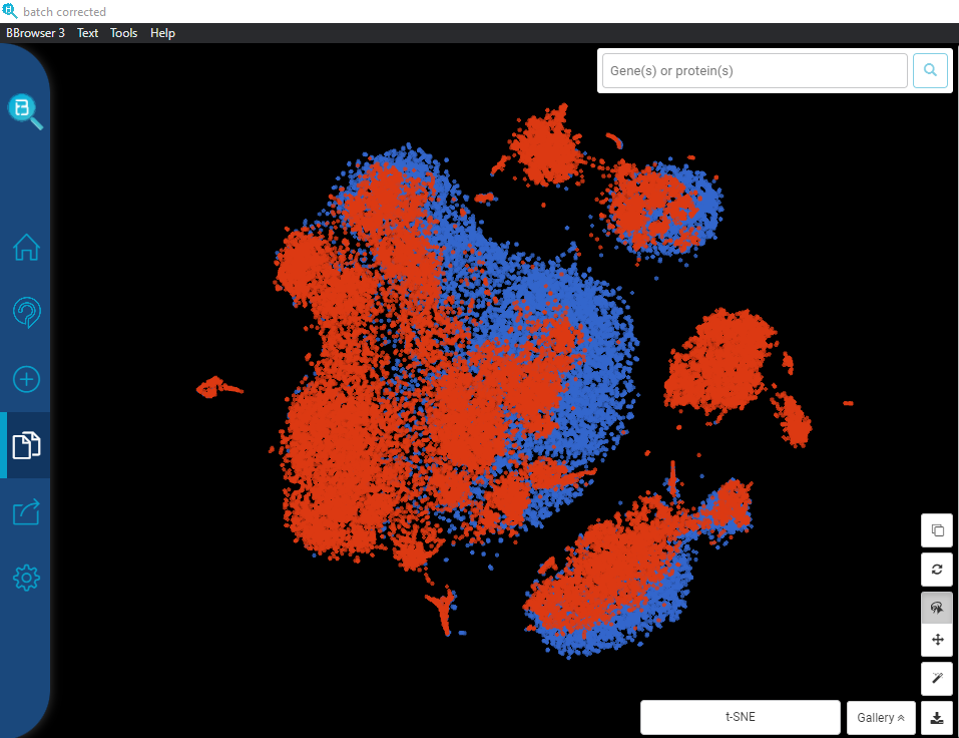
One essential step in the preprocessing of single-cell RNA-Seq data (scRNA-seq) is batch effect correction. However, much confusion remained around this step. In this article, let’s address the most frequently asked questions about handling batch effect in single-cell RNA-Seq. .  What is Batch Effect in Single-cell RNA-Seq? Batch effect happens […]

scRNA-Seq Cell Type Annotation: Common Approaches and Tools
#
scrna seq cell type annotation talk2data

Assigning cell type identity to cells is a basic yet vital step required in single-cell RNA Sequencing data analysis (scRNA-Seq), often done after dimensionality reduction and scRNA-Seq clustering . If you have successfully captured informative clusters, it’s time to face an even harder challenge: identify what cell type or cell […]

The Essence of scRNA-Seq Clustering: Why and How to Do it Right
#

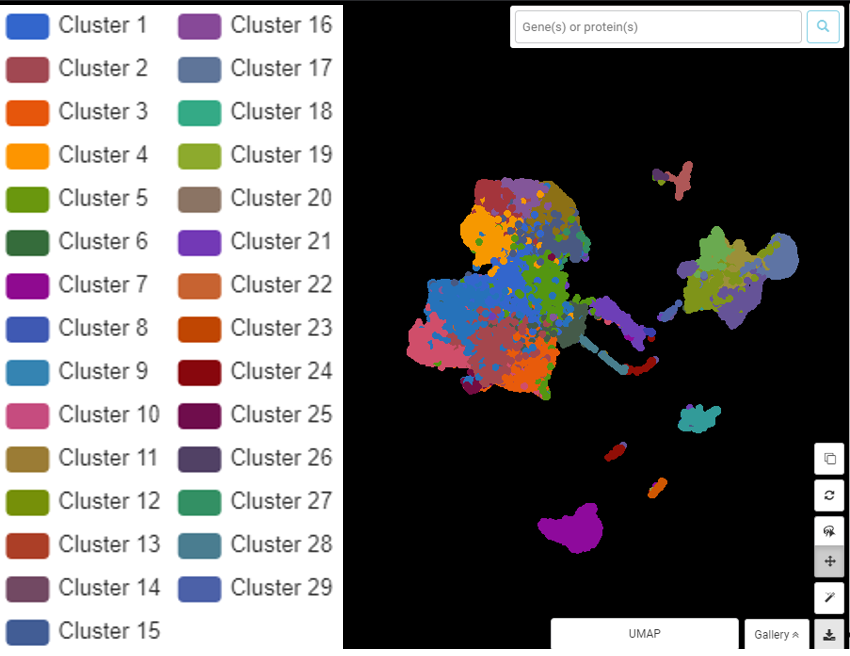
Clustering is The Microscope For scRNA-Seq data In previous posts, we have walked you through important steps in analyzing your single-cell RNA sequencing (scRNA-Seq) data, including data visualization and normalization. This time, let’s explore the next logical step in the data analysis pipeline: clustering scRNA-Seq data.  What is scRNA-Seq clustering?  […]

A Guide to scRNA-Seq Normalization
#
scrna seq normalization normalized value

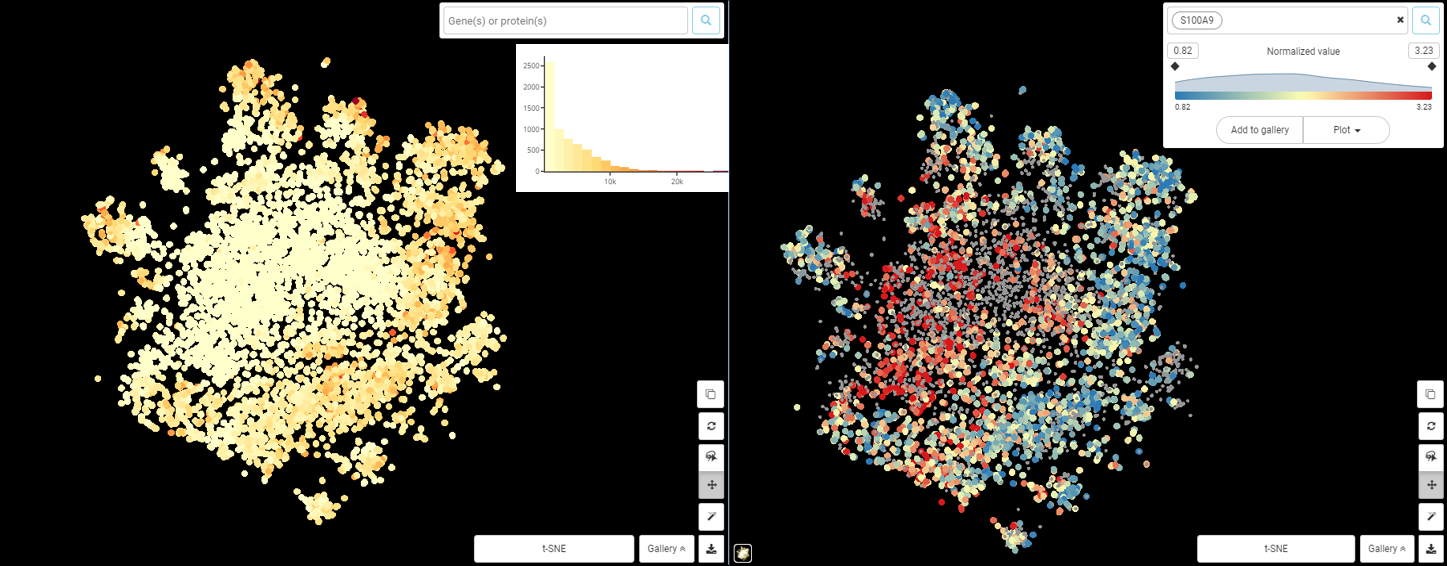
In the previous post, we talked about how to visualize single-cell RNA Sequencing (scRNA-seq) data to gain meaningful insights. But there are many steps from raw sequencing data to such beautiful visualization (and further analysis) that decide whether or not researchers can make sense of their data. They include preprocessing […]

Comparing UMAP vs t-SNE in Single-cell RNA-Seq Data Visualization, Simply Explained
#
umap vs tsne global structure

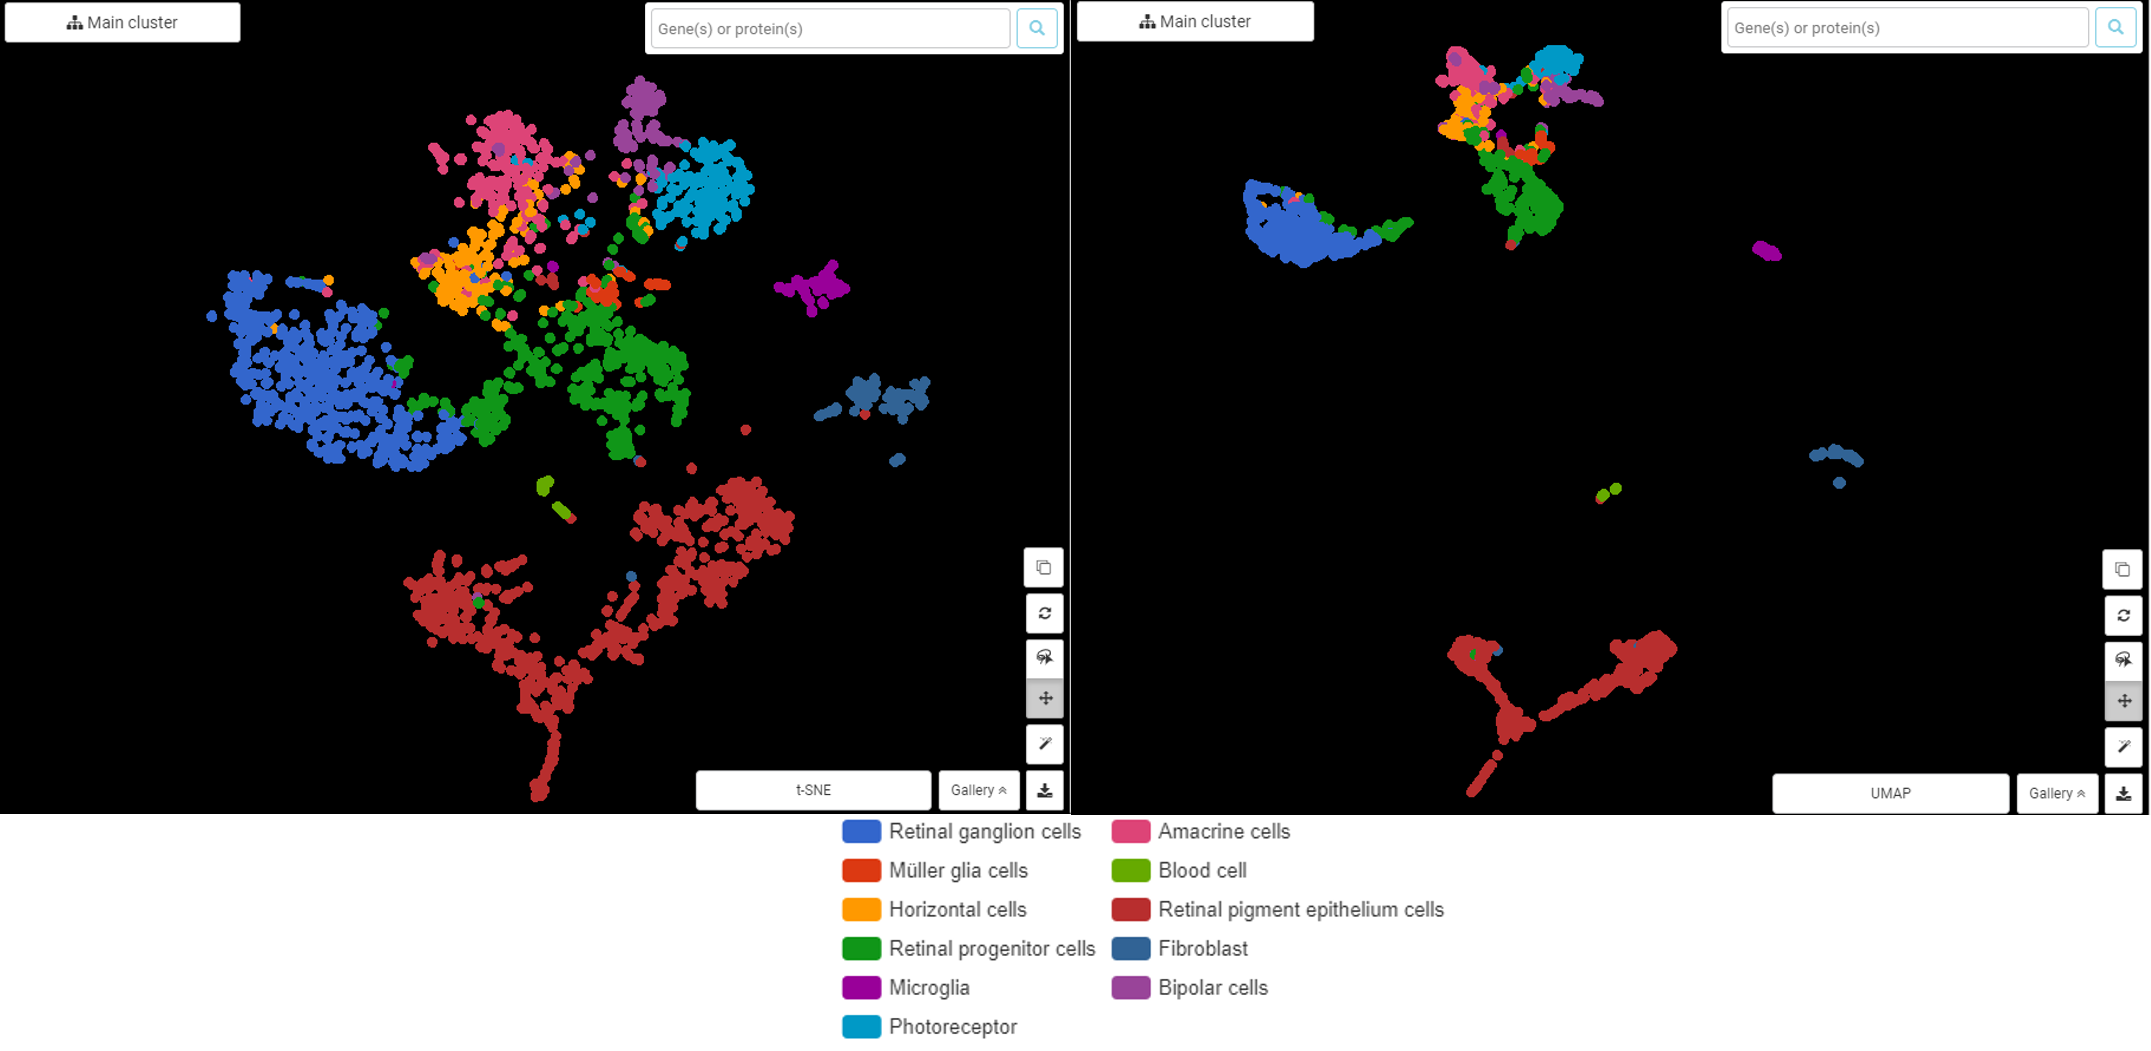
How to Make Sense of Single-cell RNA Sequencing Data? Less is More Thanks to single-cell RNA sequencing (scRNA-seq), researchers are blessed with a trove of information. Yet, this blessing is also a curse in data visualization and further analysis! Since each cell is described by its gene expression profile, our […]

Dissect a spatial transcriptomics brain dataset with BBrowser: the human prefrontal cortex by Maynard et al. (2021)
#

Spatial Transcriptomics Brain Data Is In Demand The spatial gene expression contributes significantly to brain morphology, physiology, and connectivity. However, obtaining spatial transcriptomics brain data has long been a technical challenge. Recently, with continuous breakthroughs in spatial transcriptomics sequencing technique and data analysis tools, spatial human brain single cell RNA-Seq […]