Welcome to our new BioTuring Cellpedia series!
We are excited to introduce a new blog series that provides you with an overview of some interesting datasets indexed in BioTuring Browser public repository, a platform for instant access and reanalysis of published single-cell RNA-seq data. Details on their experimental designs and key findings are manually curated and presented here, together with brief instructions on how you can explore them in BioTuring Browser.
In this first entry, let’s take a look at the dataset of “Dysfunctional CD8 T Cells Form a Proliferative, Dynamically Regulated Compartment within Human Melanoma” (Li et al., 2018), one of the most explored immune single-cell datasets in BioTuring Browser. Using single-cell RNA-seq coupled with TCR-seq pipeline, the study characterized the dysfunctional CD8 T cell population in melanoma, which is previously associated with an exhausted phenotype, as an extremely active and dynamic cell state.
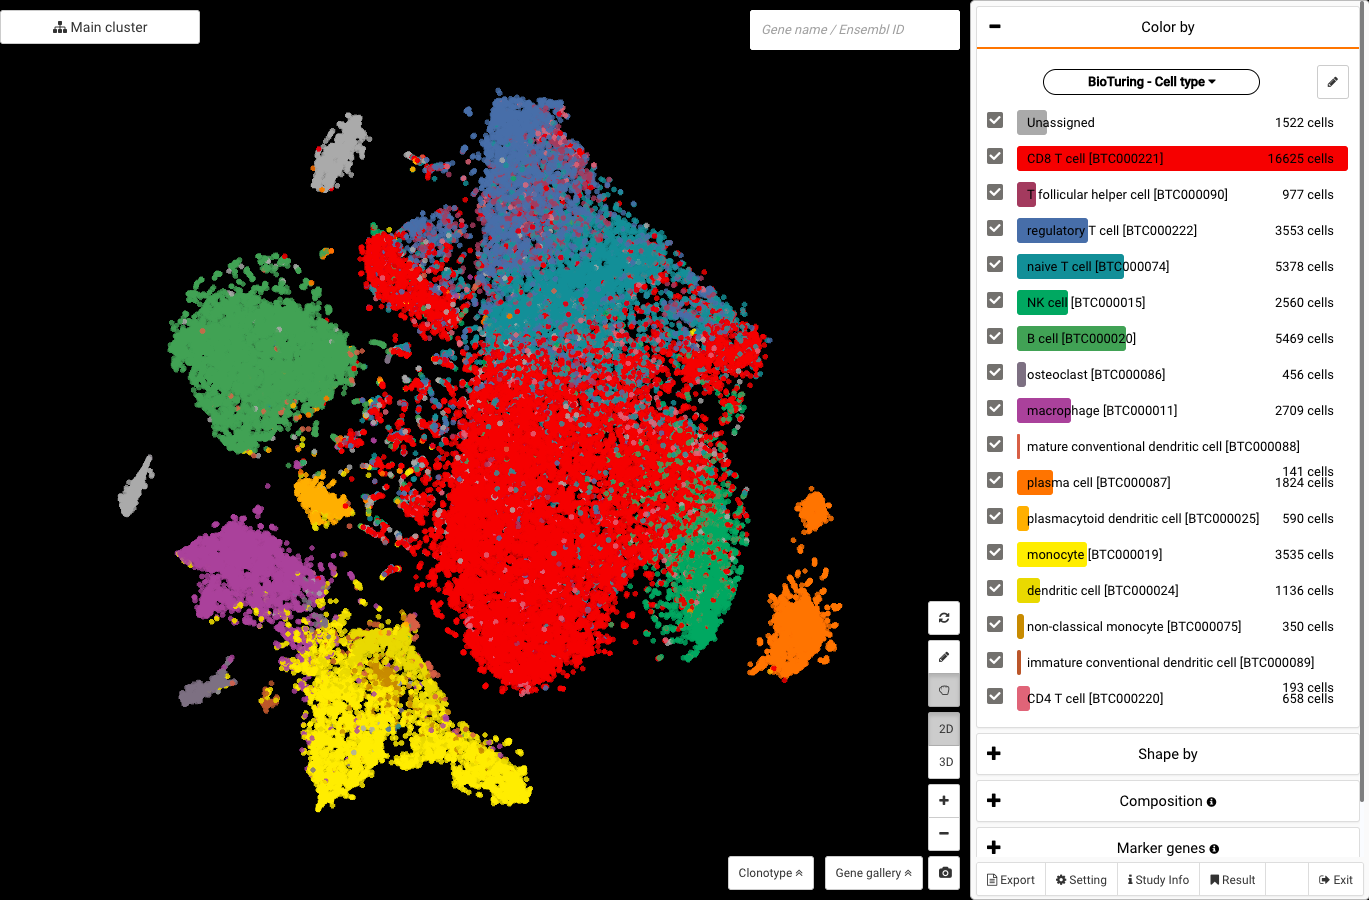
Li and colleagues’ work visualized in BioTuring Browser, colored by BioTuring’s standardized annotations with ontology numbers.
Study info
*Accession ID in BBrowser: GSE123139
*Library construction method: MARS-seq (Jaitin et al., 2014)
*Type of data: UMI count
*Species: human
*Disease: melanoma
*Sampling site: melanoma tumor, blood
*Cell types:
- Category: immune cells
- Cell types: T cells, NK cells, dendritic cells, macrophages, monocytes, tumor cells, plasma cells, B cells
*Samples:
- 25 melanoma patients (stage 2, 3, 4) with diverse treatment history (Treated, 1-immunotherapy treated, 2-immunotherapy treated, m-immunotherapy treated)
- 9 treatment-naive (stage 3) subcutaneous melanomas
*Applications: immunotherapy, immunology, CAR-T
*Keywords: T cell dysfunction, melanoma, single-cell RNA-seq, tumor microenvironment, tumor reactivity, immunotherapy, immune checkpoints, immunology, tumor immunology
*Key findings:
- A map of major immune cell types and T cell subtypes infiltrating in human melanoma
- A gradient of T cell dysfunction, unconnected with cytotoxic T cells
- Proliferative capacity of dysfunctional T cells
- The abundance of dysfunctional CD8 T cells is associated with tumor recognition
How to explore the data?
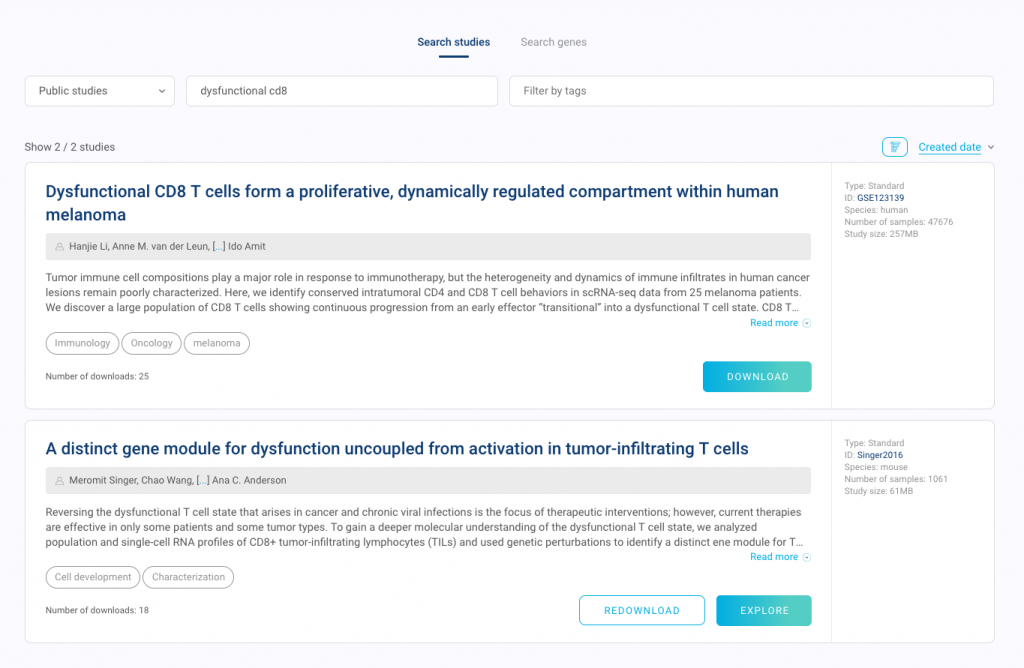
1. Access it
Open BioTuring Browser and search for its accession ID or title. You should see the Download button below its abstract. Just download it and click Explore when the download is complete.
2. View all the cell types
Once opened, the dataset will be colored by graph-based clustering results by default.
Click at the drop down under the Color by panel. Scroll your eyes to Your annotation and select T/NK group – Cell type or None T/NK group – Cell type to color your dataset with the cell type annotations from the authors. To see BioTuring’s standardized cell type annotations with our ontology number, choose BioTuring – Cell type.
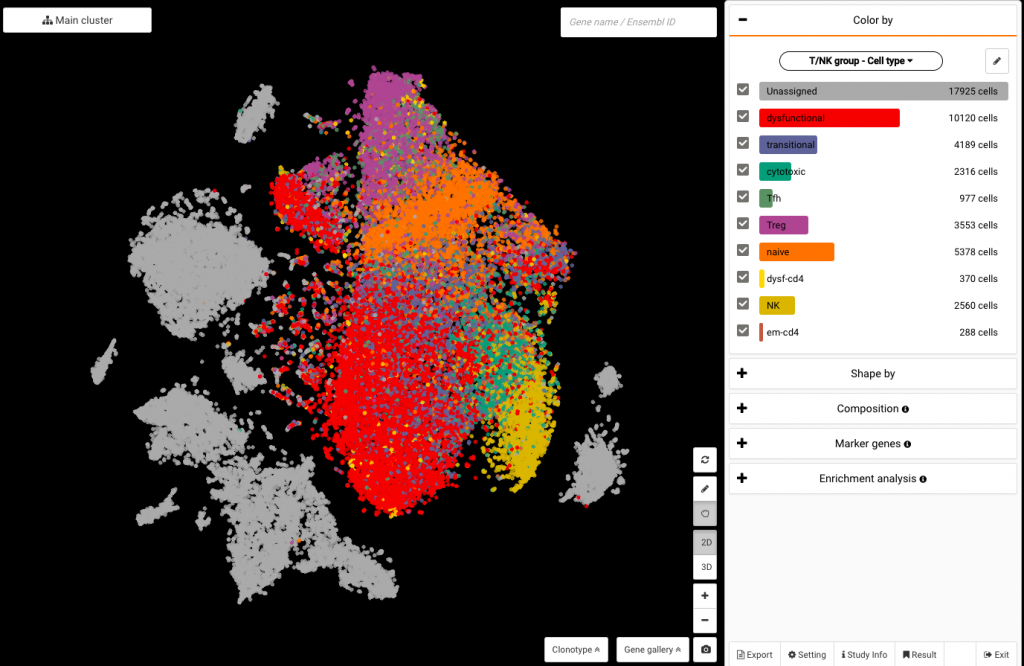
Coloring the data by authors’ annotations
3. Query genes linked with the dysfunctional states (or any genes)
Click on the box at the top corner of the screen and type in the gene name to query its expression (say LAG3). Click on the drop-down arrow to show the Dual mode button, which allows you to query another gene at the same time (say CXCL13).
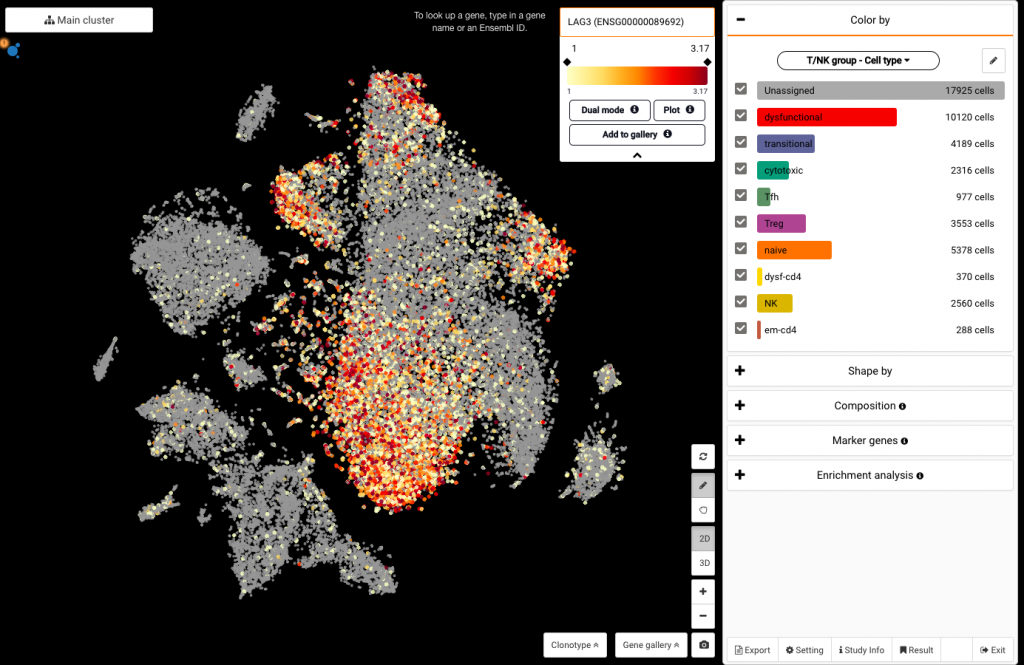
Querying LAG3 expression
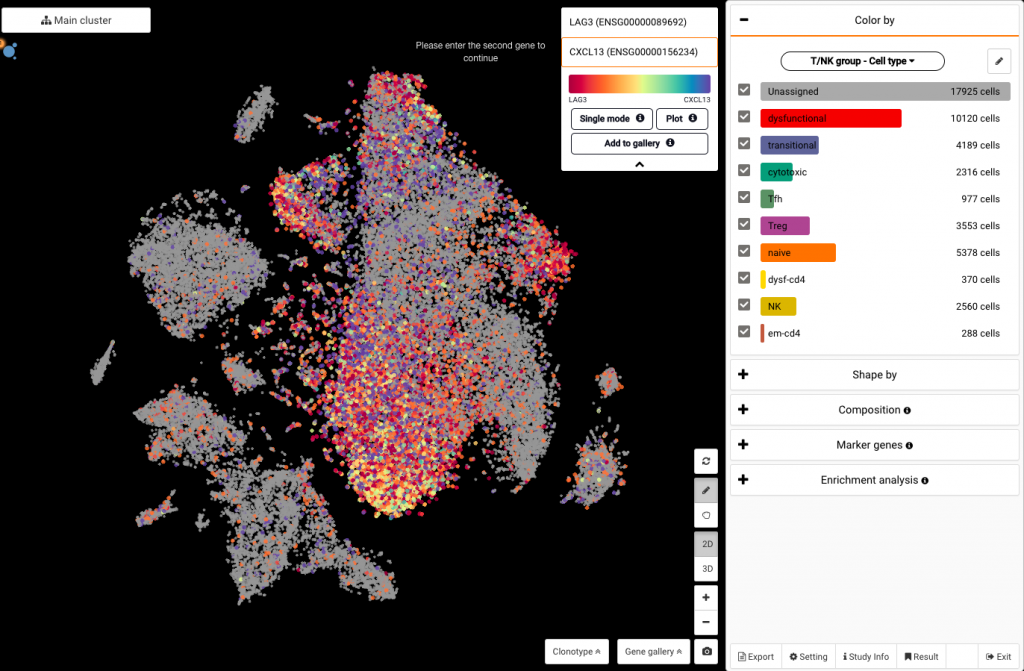
Querying LAG3 and CXCL13 expression at the same time
4. Compare LAG3 expression between T cell subsets
If you want to compare LAG3 expression across different populations of T cells, you need to color the data by the T cell subsets first (T/NK group – Cell type). Under the Color by panel, check the subsets you want to compare. Uncheck at the Unassigned group to NOT show it on the comparison plot we are about to create.
After that, simply query that gene and click the drop-down arrow to expand the query box. Then you will find the Plot button that shows the expression across the T cell subsets. Click the Settings icon at the top left corner to reorder the violins by the mean of expression levels if you want.
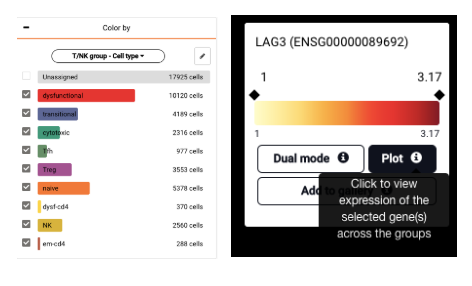
Unchecking at the Unassigned group (left) and clicking at the Plot button underneath the gene’s name (right) to compare gene expression across the remaining groups.
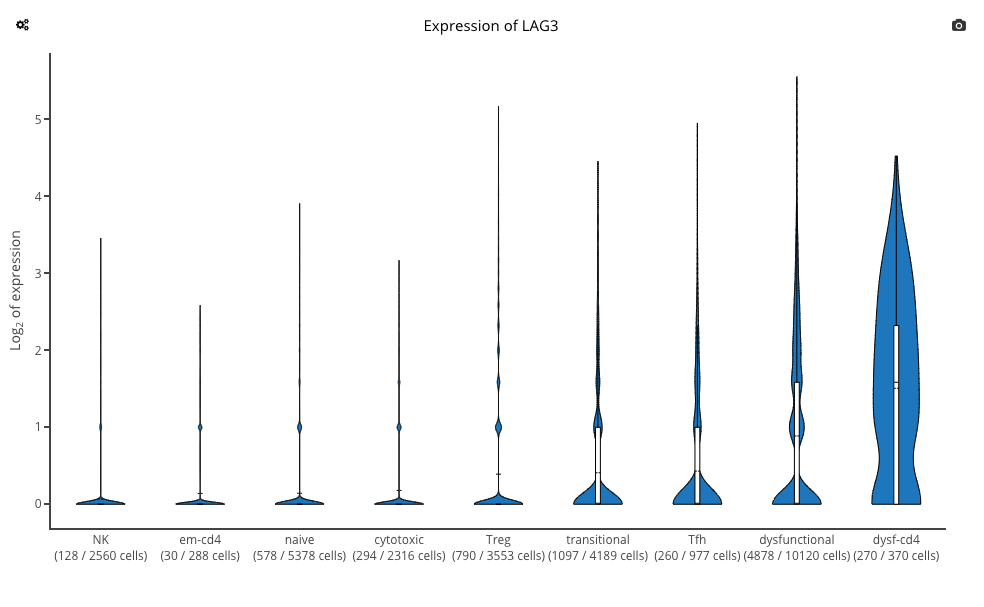
Plot of LAG3 expression across the T cell subsets
5. Compositional study of proliferating T cell populations (MKI67+)
To check the proliferative capacity of dysfunctional T cells, let’s study the composition of the proliferating T cells (marked by MKI67) and see if the dysfunctional population contributes the largest part. First, you need to color the data by T/NK group – Cell type, then uncheck at the Unassigned group and NK group. By this, we choose to only show the T cells on the screen.
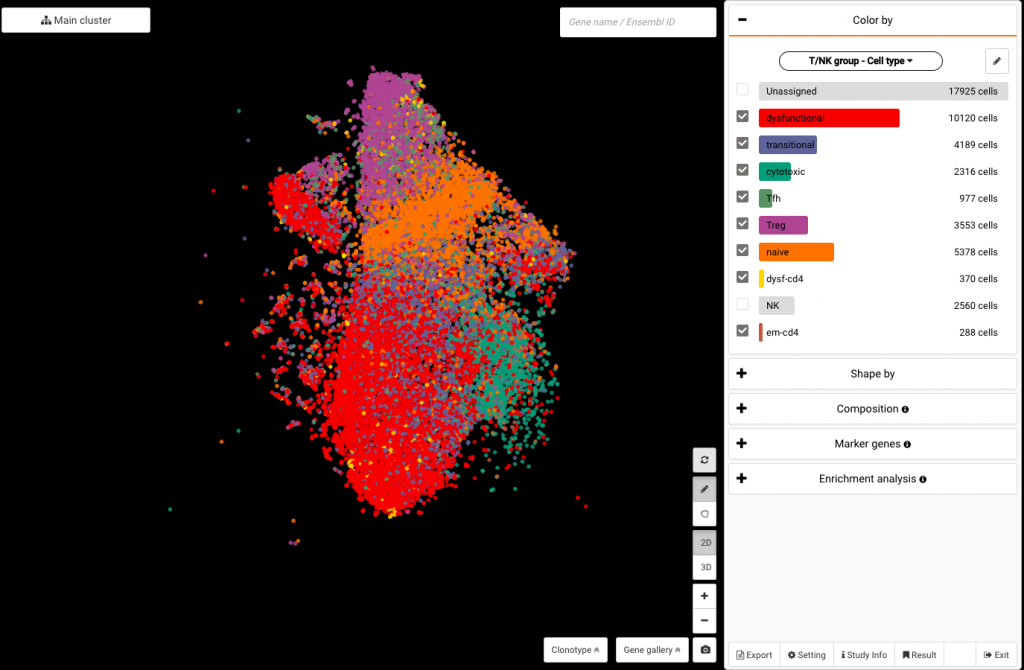
Unchecking at the Unassigned group and NK group to show T cells only
The next step is to query MKI67 and tap at the color scale below the gene’s name to select all MKI67+ T cells. Finally, expand the Composition panel and view the composition by T/NK group – Cell type. You will find that 56% of MKI67+ T cells are in the dysfunctional states.
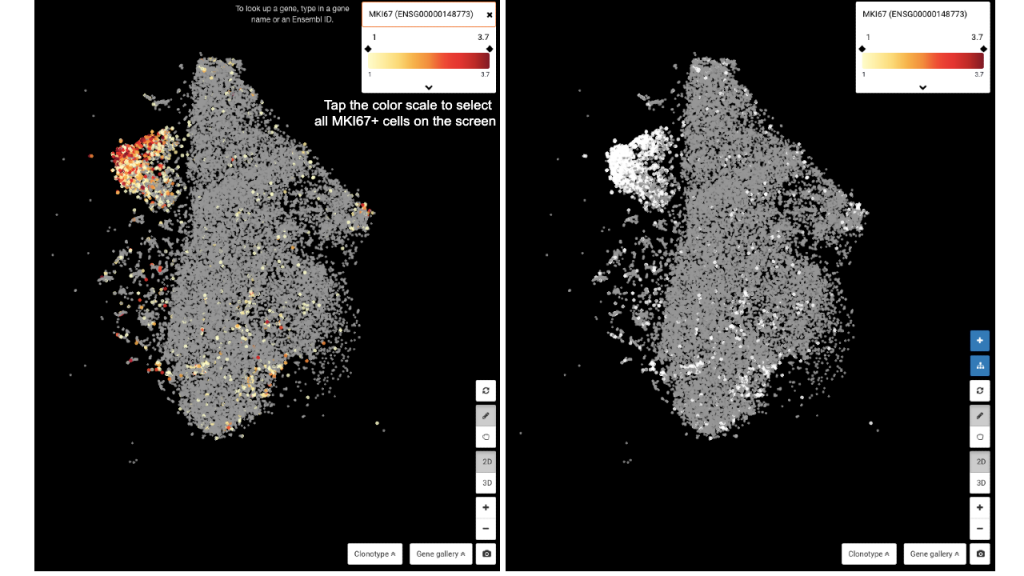
Querying MKI67 and tapping at the color scale to select all MKI67+ cells
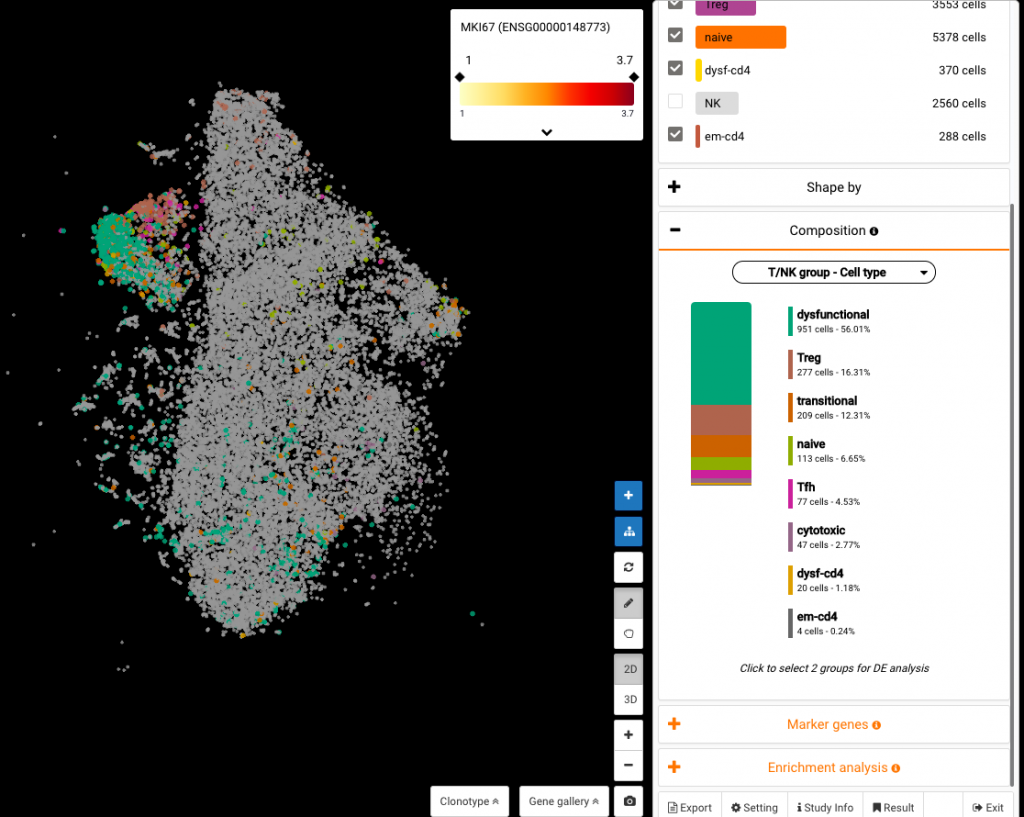
Viewing the Composition of the MKI67+ population we just selected. Dysfunctional T cells contribute 56% of the population.
And many more analytical options are available for your exploration.
Apart from the above analytics, you are supported with more dashboards and options in BioTuring Browser, including marker gene finding, enrichment analysis, sub-clustering, differential expression and TCR-seq data pairing. Enjoy your time exploring the data!