From Single-cell RNA-sequencing to Spatial RNA-sequencing
Since its invention, single-cell RNA-sequencing has become one of the most popular genomic tools. Despite its power in dissecting the transcriptome at individual cell resolution, single-cell RNA-sequencing stil faces several limitations. One of them is the lack of critical spatial information. Adding spatial context to single-cell transcriptomic profile fills in our most frequently asked questions in research: what genes are (differentially) expressed, which cells are showing changes, and where the changes take place. Knowing all the answers will greatly expand, even complete, our understanding on interesting phenomena.
This need for spatial context in single-cell RNA-sequencing leads to the invention of spatial RNA-sequencing – a combination of imaging, sequencing, and molecular characterization. Due to its importance, spatially resolved transcriptomics was named Method of the Year by Nature (Marx, 2021). Currently, the two most popular commercial platforms for spatial RNA-sequecing include 10X Genomics’ Visium Spatial Transcriptomics and NanoString’s GeoMx Digital Spatial Profiler (DSP).
Spatial transcriptomics data analysis is a key function in BioTuring Browser. In an earlier post, we have shown you how to Explore 10X Visium Spatial Transcriptomics data at ease with BioTuring Browser. We recently expand our toolkit to support NanoString GeoMx DSP data. This article will show you how you can use BBrowser for your spatial transcriptomics data from NanoString GeoMx DSP.
NanoString GeoMx Digital Spatial Profiler: In a Nutshell
NanoString introduced their spatial technology in 2019, quite the same time as 10X Visium. The working principles of NanoString GeoMx DSP is summarized in Figure 1 (Li & Wang, 2021). The foundation of this platform is NanoString’s molecular barcoding technology, where oligo-barcodes can be attached to fluorescent antibodies via photocleavable linkers. The oligo-barcodes map to mRNAs during in situ hybridization, get snapped off during imaging (while recording spatial information), and finally get sequenced.
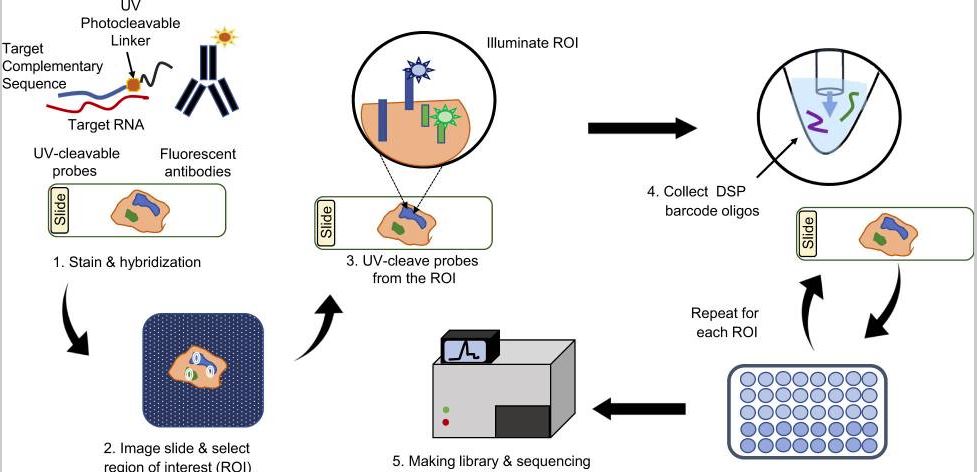
Figure 1. The working principles of NanoString GeoMx DSP (Li & Wang, 2021)
Run NanoString GeoMx Data Analysis with BBrowser
BBrowser supports spatial transcriptomics analysis from both 10X Genomics and NanoString technologies, allowing users the flexibility of input data. We have introduced how to Explore 10X Visium Spatial Transcriptomics data at ease with BioTuring Browser.
Here, we’ll demonstrate a NanoString GeoMx Data Analysis with BBrowser, using a human brain dataset from NanoString Spatial Organ Atlas.
The dataset contains 5 FFPE tissue sections from 5 white, male donors aged 70 to 90 years old. The whole transcriptome atlas profiled over 18,000 genes, with 252 regions of interest covering subregions of the cortex and hippocampus.
- Prepare Input Data
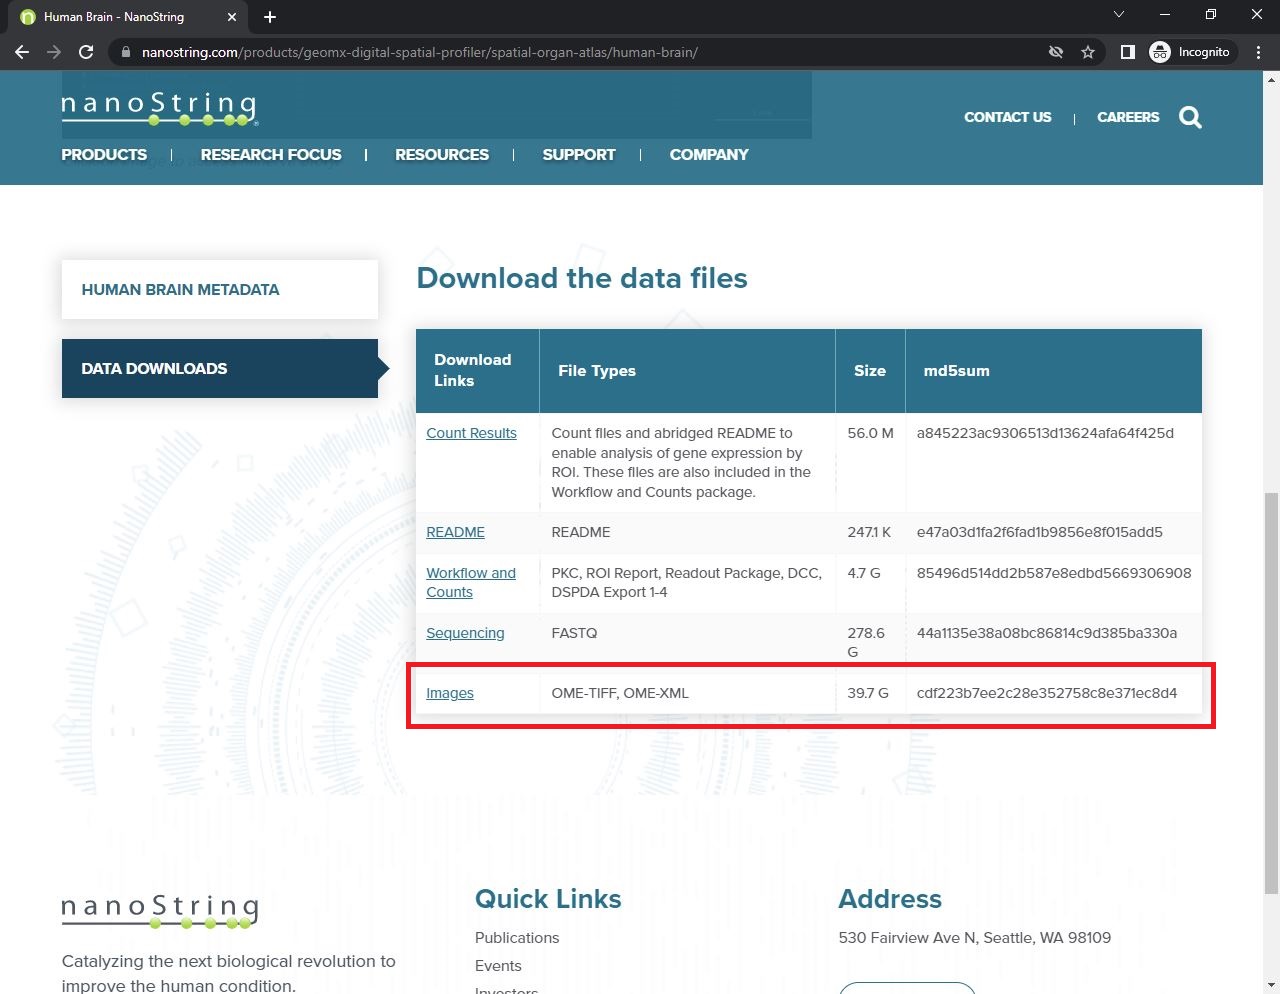
First, you need NanoString GeoMx DSP data under OME-TIFF format. For this dataset, you can go to Data Downloads and choose “Images”. The data will include image files (.tiff format) and an excel file containing the images’ metadata.
Next, you must convert the OME-TIFF file it into a folder using our pyBCS package (find the package here) as instructed.
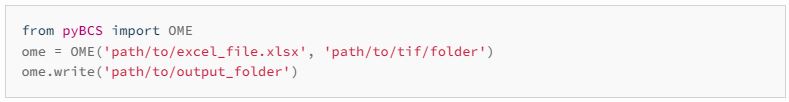
The output of this conversion is a folder with 2 files and 1 spatial folder:
- counts.csv.gz
- metadata.csv.gz
- a folder named “spatial”, containing the following files: info.json, and images (only .tif file)
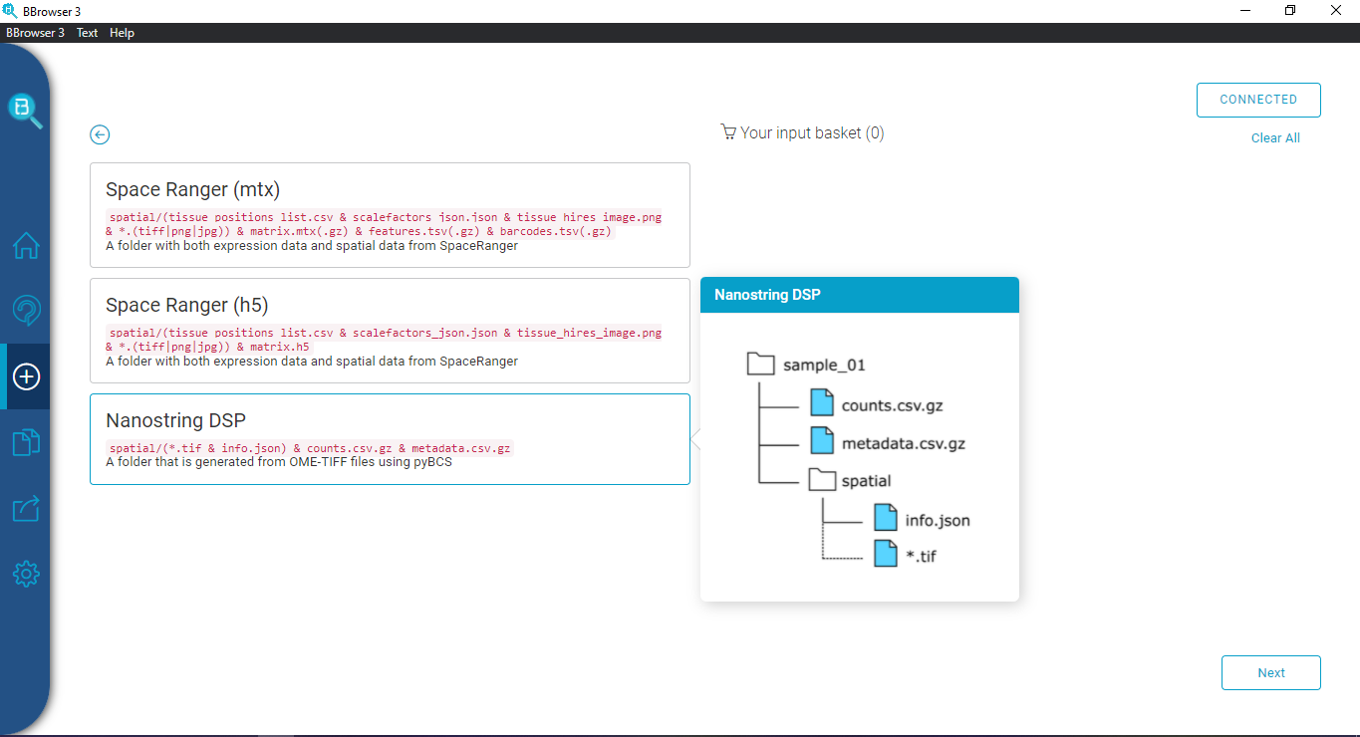
This is your input file into BBrowser. Note that when uploading the file, you must keep the names exactly as mentioned above, otherwise BBrowser won’t recognize the data.
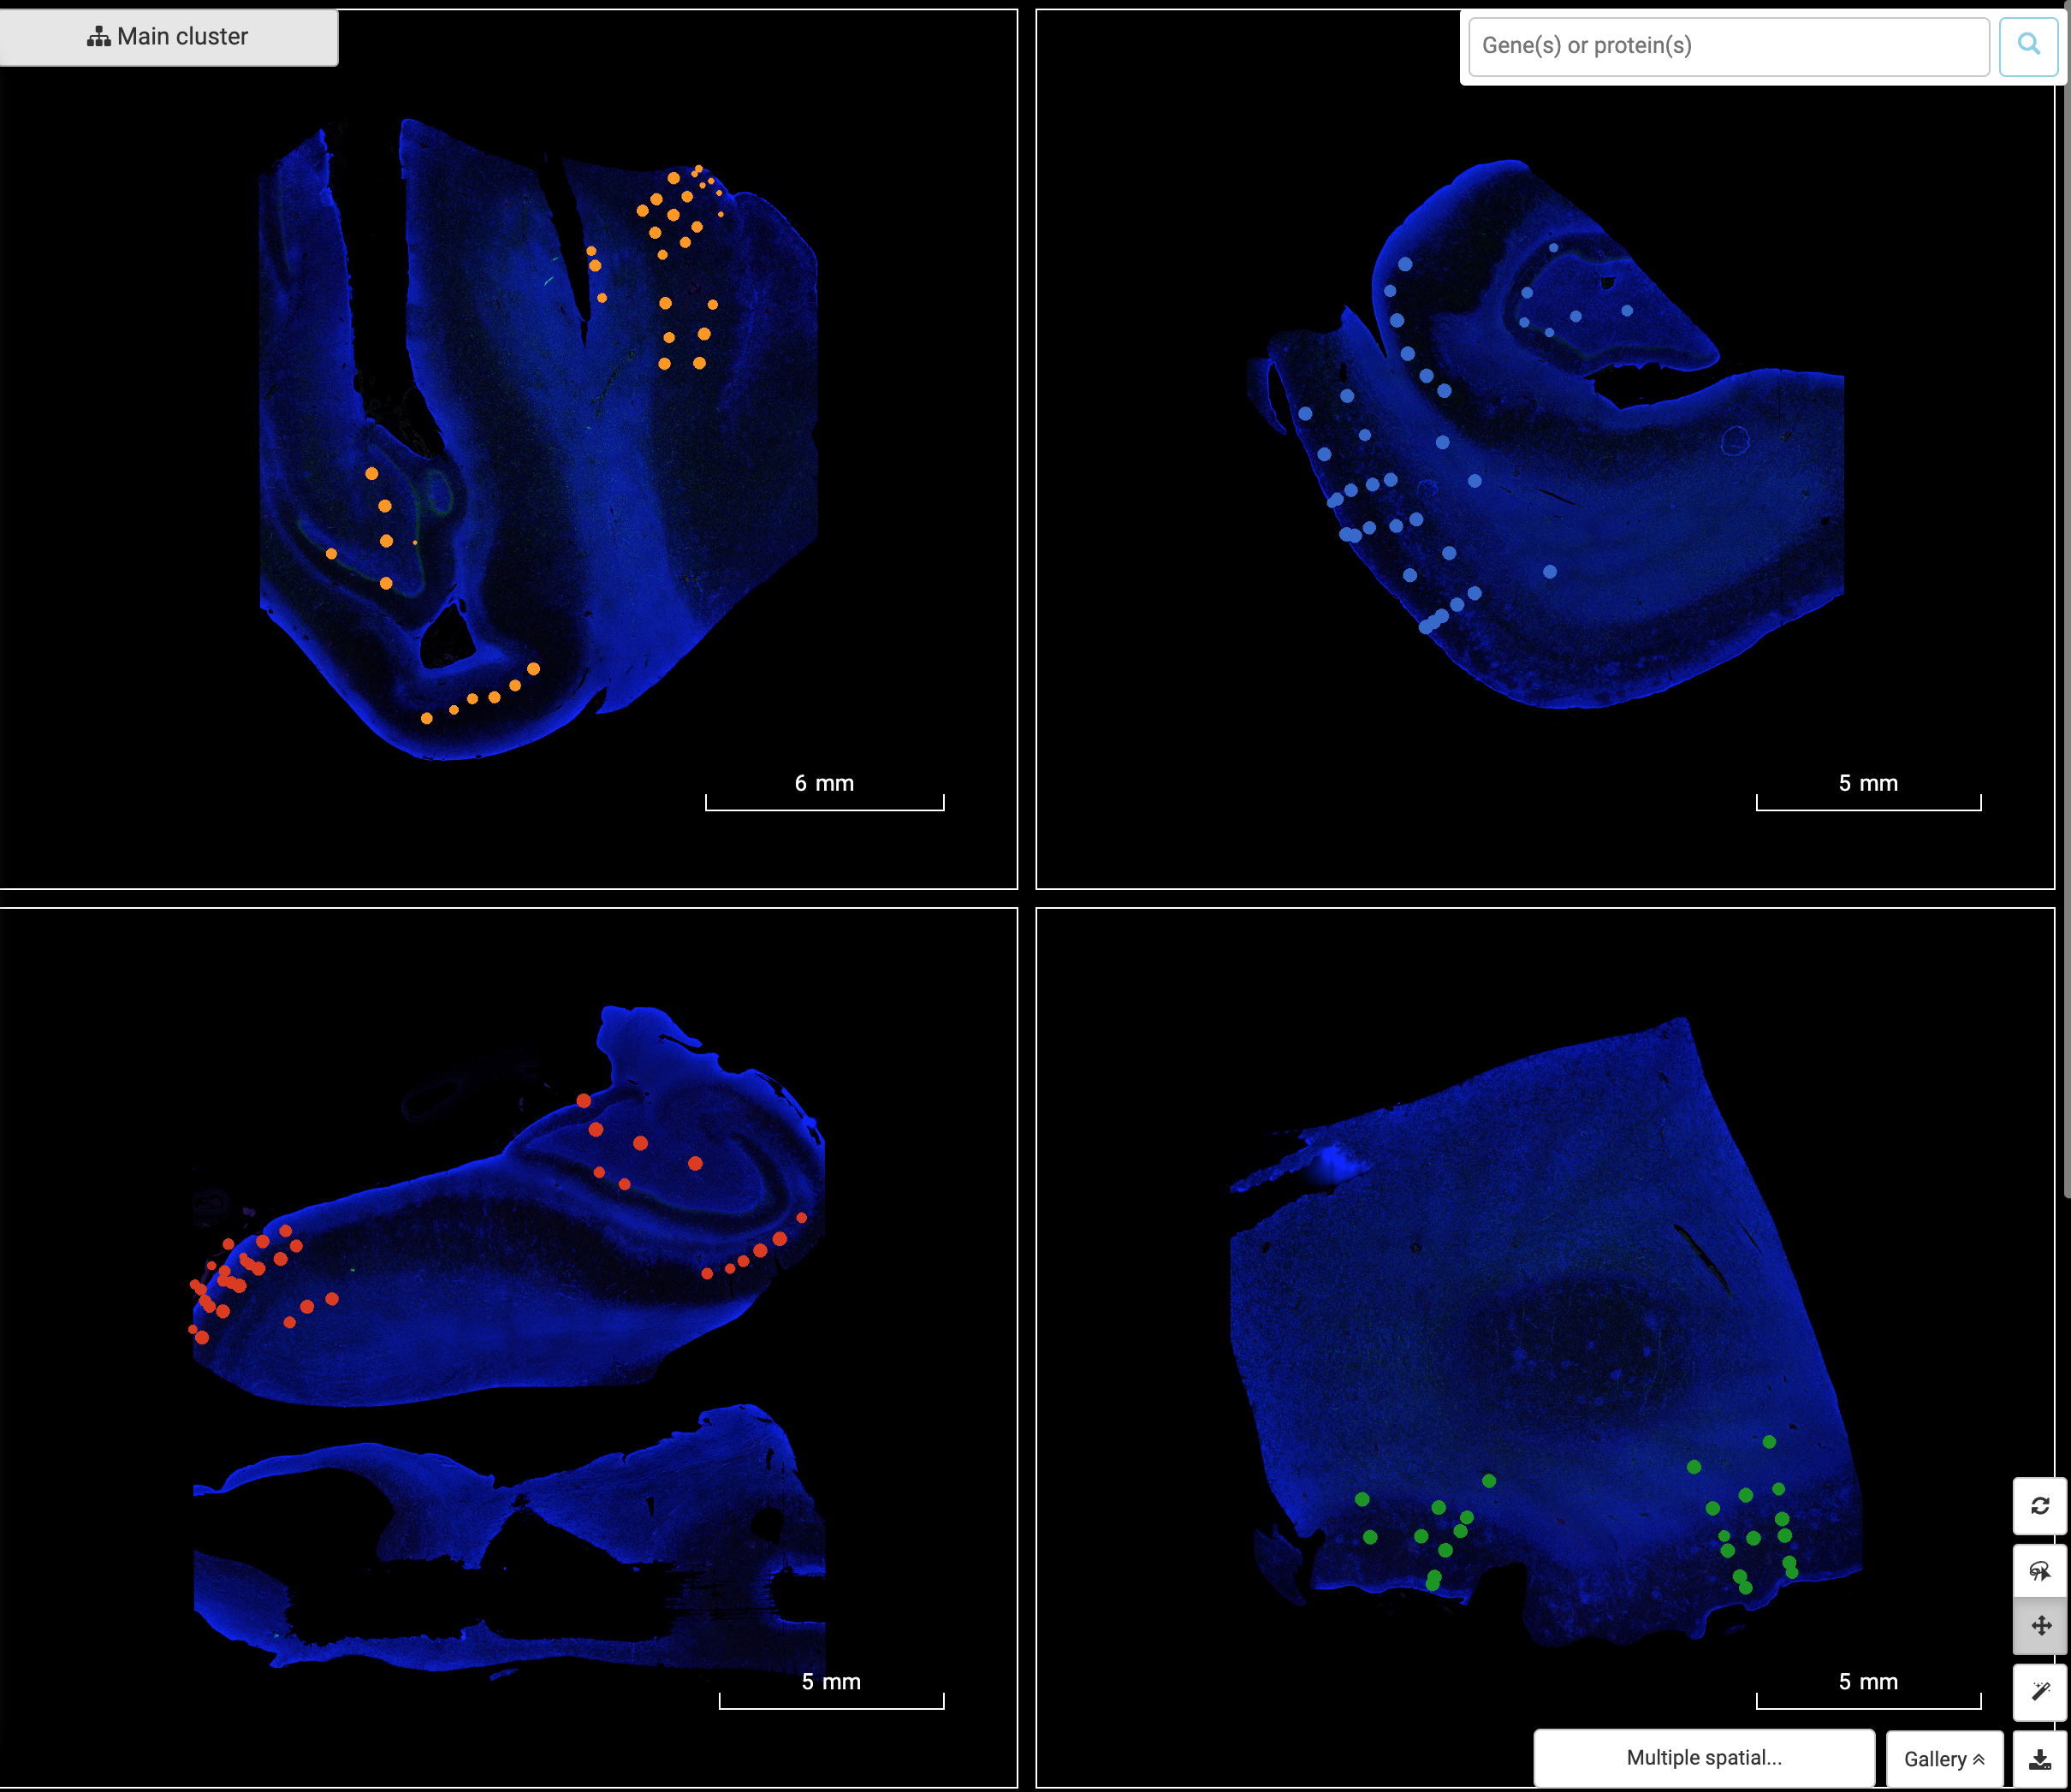
2. Interactively explore multiple slides
BBrowser supports viewing multiple spatial images of the dataset at a time. You can view the tissue images with or without ROIs by adjusting ROIs’ opacity in graph settings.
3. Query genes and protein across Regions of Interest. Visualize gene/protein expression on tissue image.
You can also see how a gene or multiple genes are expressed and co-expressed on the spatial coordinates. Just type the gene name or its Ensembl ID or alias into the gene query box at the top and Enter. The scatter plot visualizes gene/protein expression level on tissue image. When querying multiple genes/proteins, users can view gene expression and their correlation via different plots.
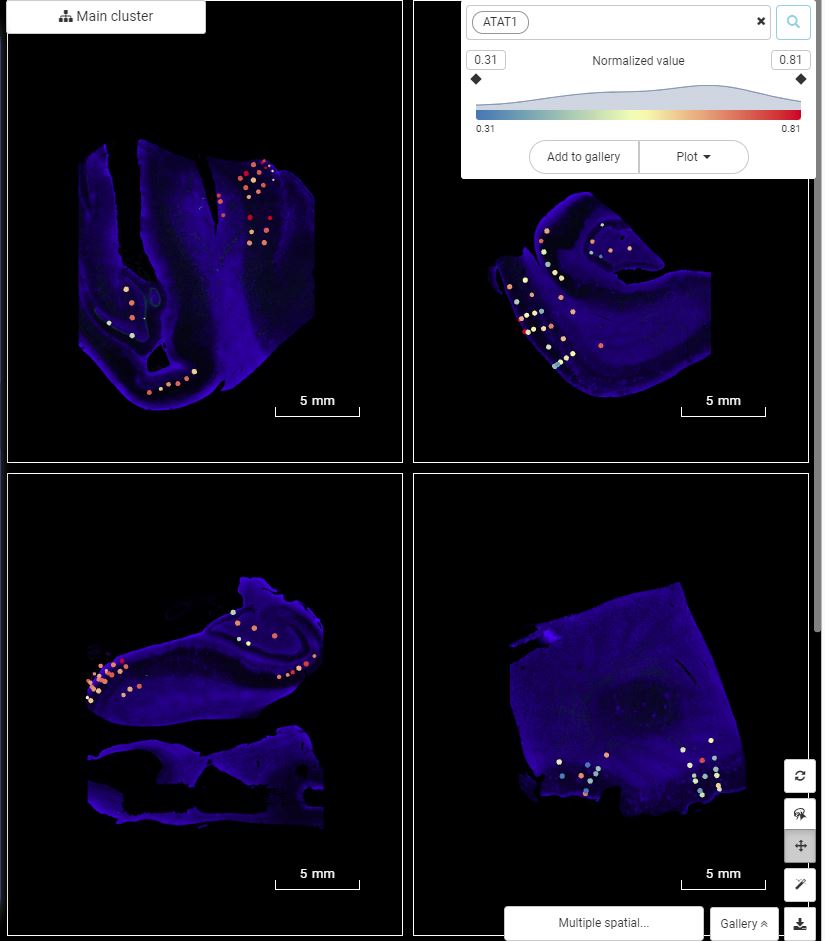
View the expression of a gene (or protein) across multiple tissue images
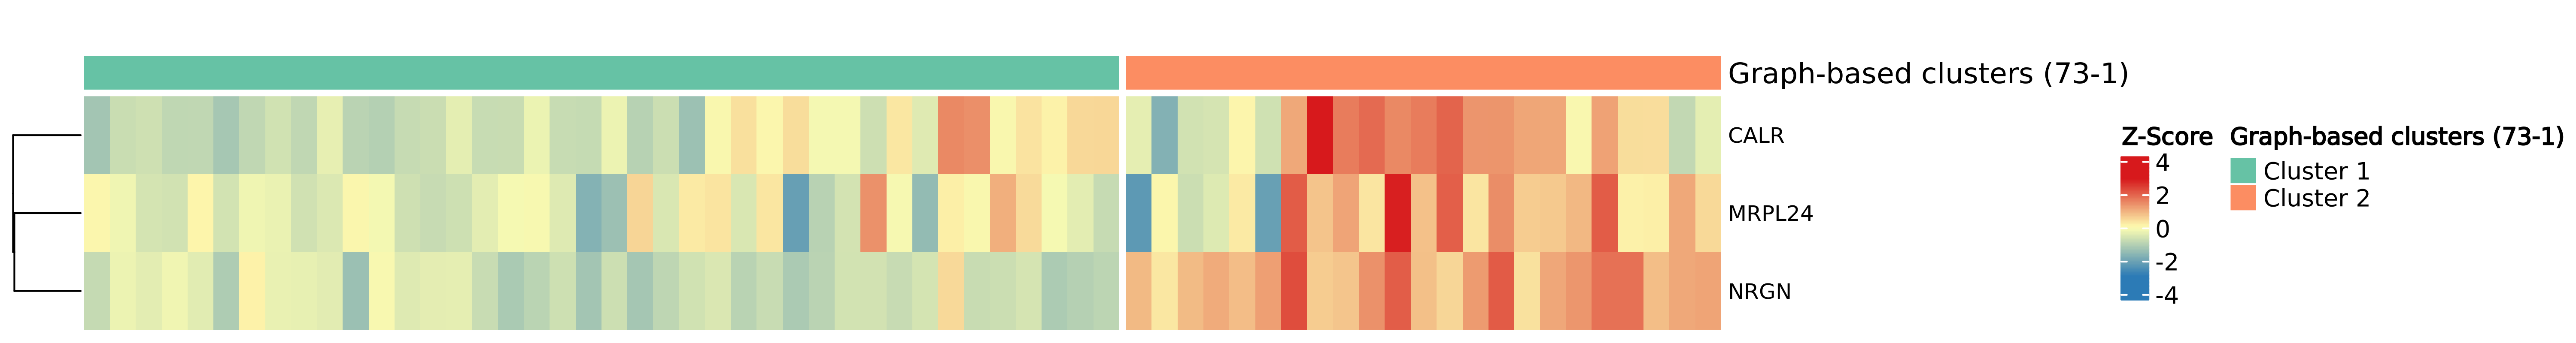
A heatmap of multiple gene expression in one tissue slide reveals some candidates that distinguish two clusters
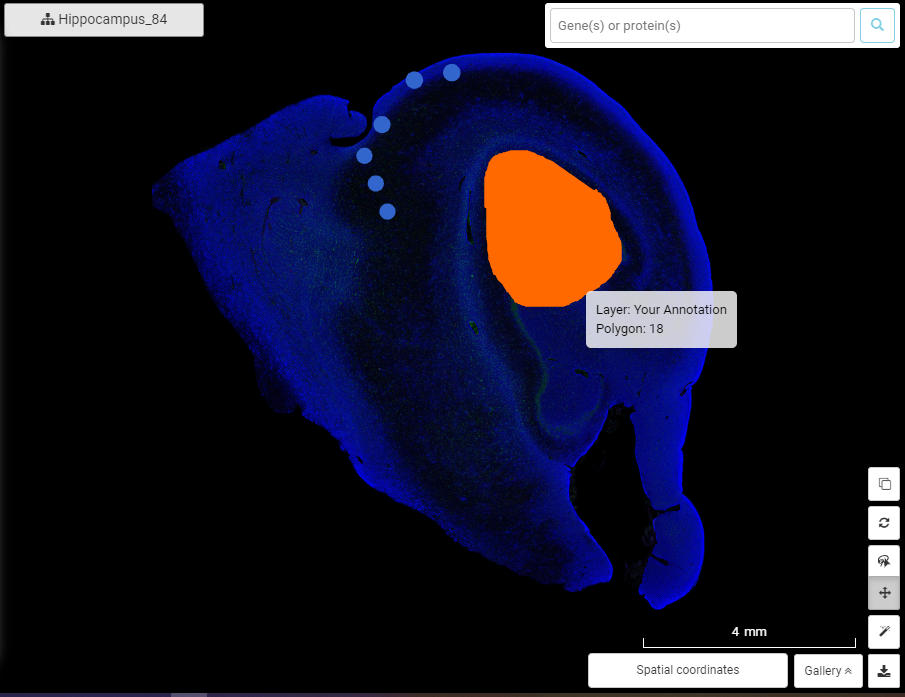
4. Pathologically annotate tissue sections
BBrowser supports labeling pathological annotation directly on spatial images. We are developing our AI-driven engine called BioTuring Lens to support cell segmentation, which will enhance the analysis power.
For now, you can choose a tissue region on the spatial slide, annotate, and color it.
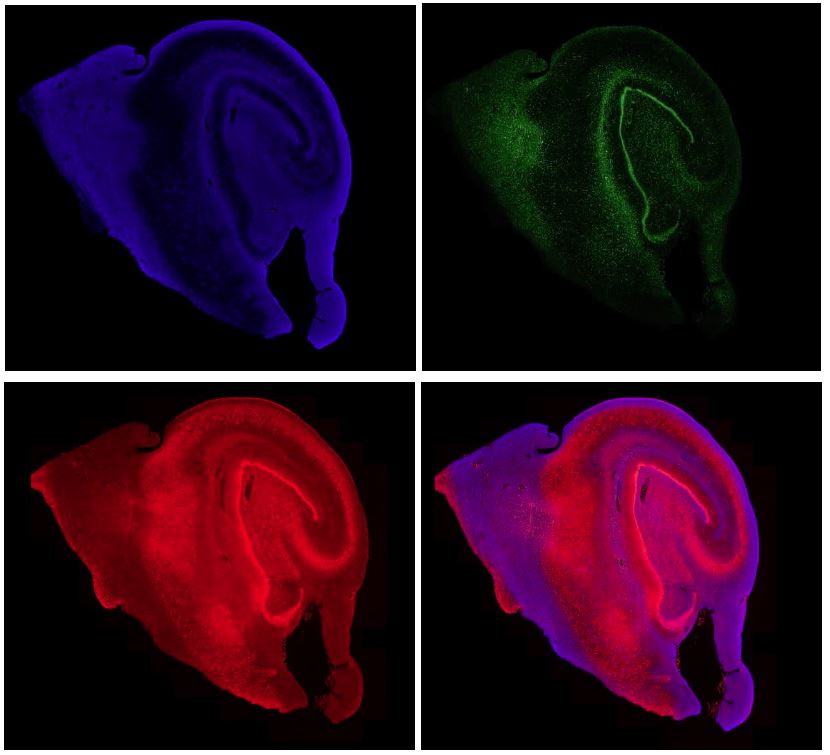
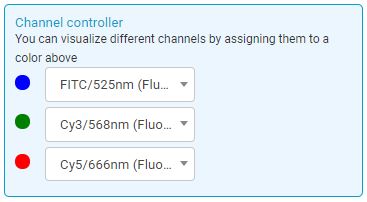
5. Channel controller for multiplex data
For each multiplexed image, users can visualize different channels by assigning them a color scheme. Highlight each channel or overlay them to dissect the morphological structure of your tissue sample at ease
Closing
A commonly asked question is “what’s the difference between 10X Genomics vs NanoString spatial transcriptomics platform?” Both are top widely used tools in spatial transcriptomics. While there are some similarities between the two platforms, the key differences between 10X Genomics vs NanoString are:
- The 10X Visium platform utilizes a microarray approach, while NanoString adopts the in situ hybridization approach.
- 10X Visium platform is more flexible in setup as it doesn’t require specialized equipment, thus more accessible to an average laboratory. On the contrary, the NanoString platform is more expensive and would suit highly-equipped laboratories.
- 10X Visium is not single-cell resolution (but it’s getting there) while NanoString can obtain single-cell resolution. Nevertheless, both platform still face challenges in low sensitivity, low signal-to-noise ratio.
- 10X Visium captures whole tissue sample while NanoString allows users to define regions of interest.
Regardless of which platform you choose, BBrowser supports data from both 10X Genomics and NanoString GeoMx. We hope our tutorials help you run spatial transcriptomics analysis smoothly with BBrowser . Don’t hesitate to contact us at support@bioturing.com if you have any question!
Reference:
Marx, V. (2021). Method of the Year: spatially resolved transcriptomics. Nature methods, 18(1), 9-14.
Li, X., & Wang, C. Y. (2021). From bulk, single-cell to spatial RNA sequencing. International Journal of Oral Science, 13(1), 1-6.