Performing single-cell quality control is a vital step in the data analysis pipeline. Setting QC parameters can significantly affect downstream analysis: too permissive QC filtering makes the dataset too noisy to read, and too stringent QC thresholds may remove important information.
In this article, let’s discuss the art of setting single-cell QC parameters. We’ll explain some important QC parameters, the rationale behind some thresholds commonly used by the community, and pitfalls that you should watch out for when setting single-cell quality control parameters.
Understand Important Single-cell Quality Control parameters
The main goal of single-cell quality control is to filter out low-quality cells, such as dead cells, cells with technical issues during sequencing (e.g multiplet, broken cells, empty droplets, etc.), cells with too little information/value provided (e.g low reads, low number of genes expressed, etc.).
To judge whether a cell is of bad quality, quality control often looks at the three following parameters:
- The number of counts per barcode, also known as the “count depth”: this parameter corresponds to how many transcripts were sequenced in a cell. A low count depth may indicate poor sequencing or dead cells, while an abnormally high count may come from doublets.
- The number of genes per barcode: similar to the count depth, this parameter also indicates whether a cell is poorly sequenced, dead, or doublets.
- The number of mitochondrial genes per barcode: this parameter is often converted to the proportion of transcripts mapped to mitochondrial genes or ‘mitochondrial fraction”. A high mitochondrial fraction is an indicator of apoptotic cells or cells with broken membranes during sequencing (if cells are broken, cytoplasmic mRNAs get leaked out and only mitochondrial mRNAs are sequenced)
Despite no agreement on how to set single-cell quality control parameters, a rule of thumb exists:: to exclude cells with less than 200 genes and more than 5% of mitochondria counts. This set of thresholds comes from early studies, such as Ilicic et al, (2016), Lukassen et al., (2018) and was recommended by Seurat, thus making it widely popular in the community of single-cell RNA-seq researchers.
There are some additional parameters that help speed up downstream analysis and reduce noise, such as:
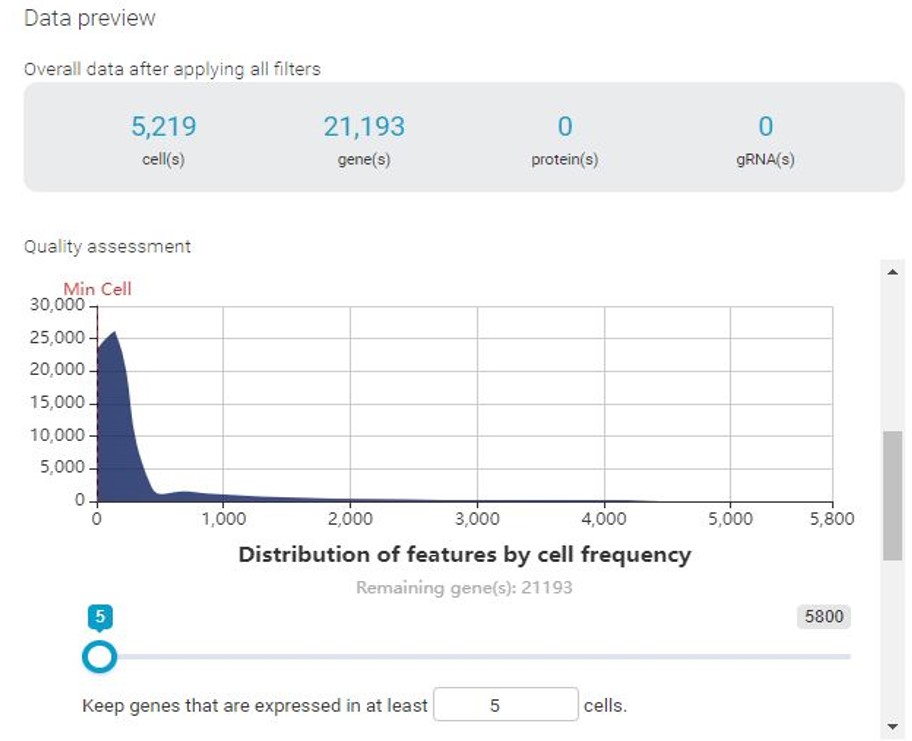
- Filter out genes that express in less than X number of cells: such genes are either not informative enough or a sign of dropouts. A common threshold for minimum cells per gene is 5.
- Filter out cells that express less than X number of genes: it’s hypothesized that a cell needs at least 200 genes to function properly (Gil et al., 2004). Cells with fewer genes may suffer from damage or poor technical processing and thus provide less valuable information.
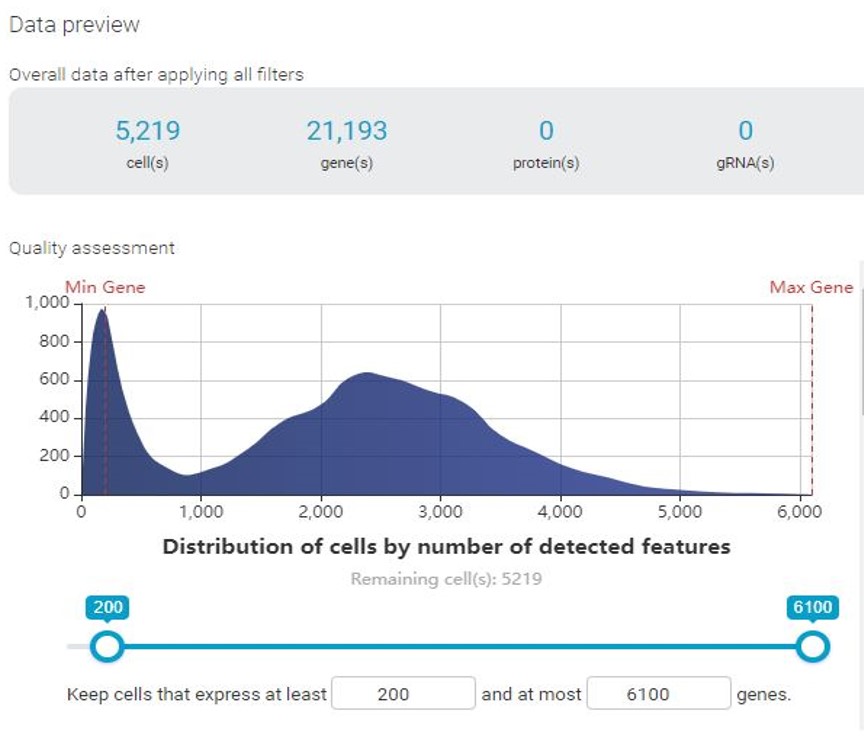
In BBrowser, users can either go with the default preprocess settings that we provide, or adjust the parameters for your specific needs.
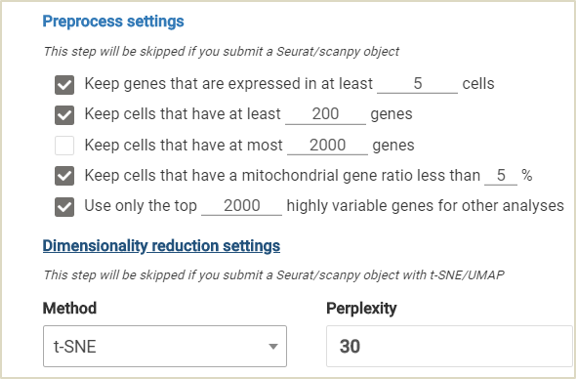
BBrowser makes single-cell quality control easier. Users have a range of parameters to select and adjust as you wish with simple UI
Setting Single-cell Quality Control Parameters is A Complex Task: Common Pitfalls
1. Single-cell Quality Control Parameters are Data-specific
The parameters mentioned above are not universal. For each dataset, several factors can affect how each threshold should be determined. Here are 3 examples highlighting the importance of this point.
Example 1: the mitochondrial count parameter is highly dependent on the sample type. Mitochondrial genes are involved in several processes, such as gene regulations, cancer, aging, degenerative diseases, etc. A high mitochondrial count may indicate high respiratory activity, rather than apoptosis. Different tissues also vary in the mitochondrial count. Mercer et al. (2011) observed that this number can range from 5% to 30% between tissues due to varied energy demands. Other factors can also contribute to the variation, such as species, sequencing platforms, sample conditions, etc. A recent study from Osorio & Cai (2021) found that the average proportion of mitochondrial DNA in scRNA-seq data from human tissues is significantly higher than in mouse tissue. The authors recommended a new standardized threshold for the mitochondrial count of 10% in human samples, and 5% for mouse samples.
Example 2: the minimum cells per gene threshold. Usually, genes expressed in less than 5 cells are removed, however, this threshold should be set according to the smallest cluster size and the overall sample size. In the example below from Wang, et al. (2016) study on the human endocrine pancreas transcriptome, some cell types exist as very small clusters (e.g acinar cell – 6-cell cluster, δ-cell – 9-cell cluster). A threshold of 5 cells per gene may remove several specific marker genes in such tiny clusters (Figure 1). In such cases, the minimum cells per gene threshold is not necessary.
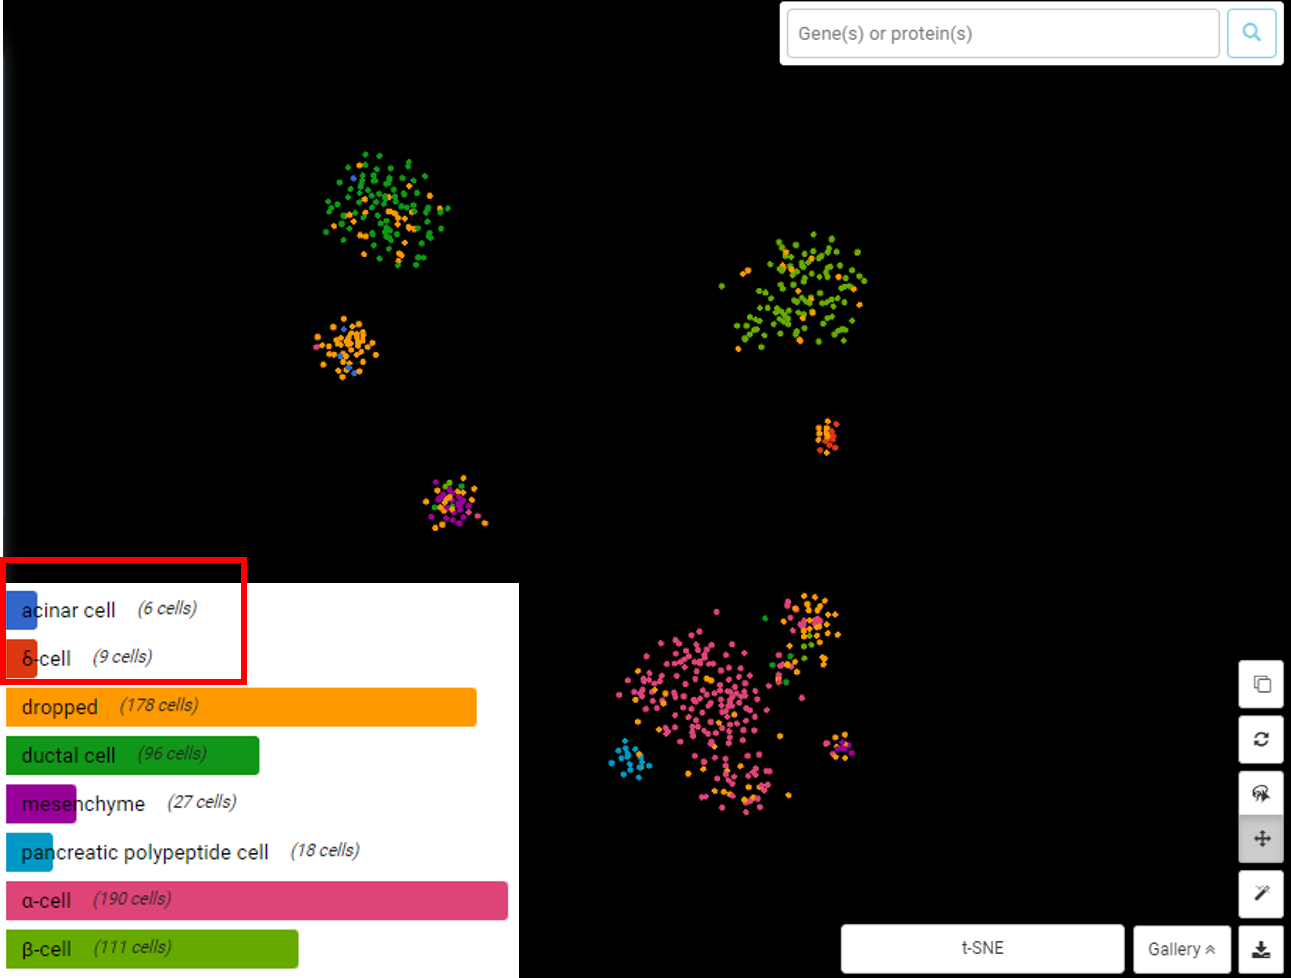
Figure 1. In this dataset of Wang, et al. (2016), acinar cells and δ cells exist in smaller-than-usual clusters (6 and 9 cells, respectively). Visualization by BBrowser
Example 3: the count depth. Cells with low counts and/or genes may correspond to quiescent cell populations, and cells with high counts may be simply larger in size (example Figure 2). In this dataset of Velten, et al. (2021) on leukemic and pre-leukemic stem cells, the majority of CD34+HBZ+ blast cells have a lower count depth than the rest of the dataset. If we place a cut-off at the red line, we’ll inadvertently remove most of this cell population.
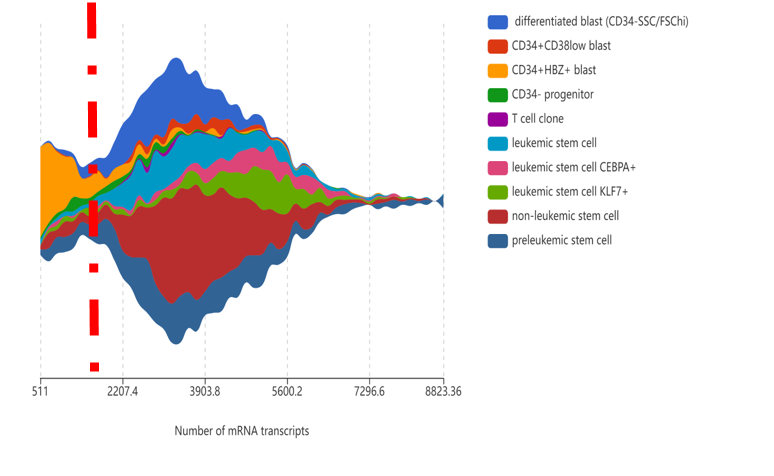
Figure 2. Setting the wrong count depth threshold may filter out quiescent cell populations. Visualization by BBrowser
2. Single-cell QC Parameters should be considered jointly
Adjusting QC parameters jointly can lead to more efficient filtering. Luecken & Theis, (2019) demonstrated how visualizing QC parameters together helps identify more suitable thresholds: Figure 3 shows two cell populations with opposite QC distributions: one population contains cells of a high number of genes but low to moderate count depth, and the other contains cells with a low-to-moderate number of genes but high count depth. Cells are colored by the mitochondrial fraction.
If each parameter is set individually, only a small number of cells can satisfy all thresholds. By combining them together, we can easily locate poor-quality cells (low count depth, low genes, and high mitochondrial fraction) and retain as many viable cells as possible.
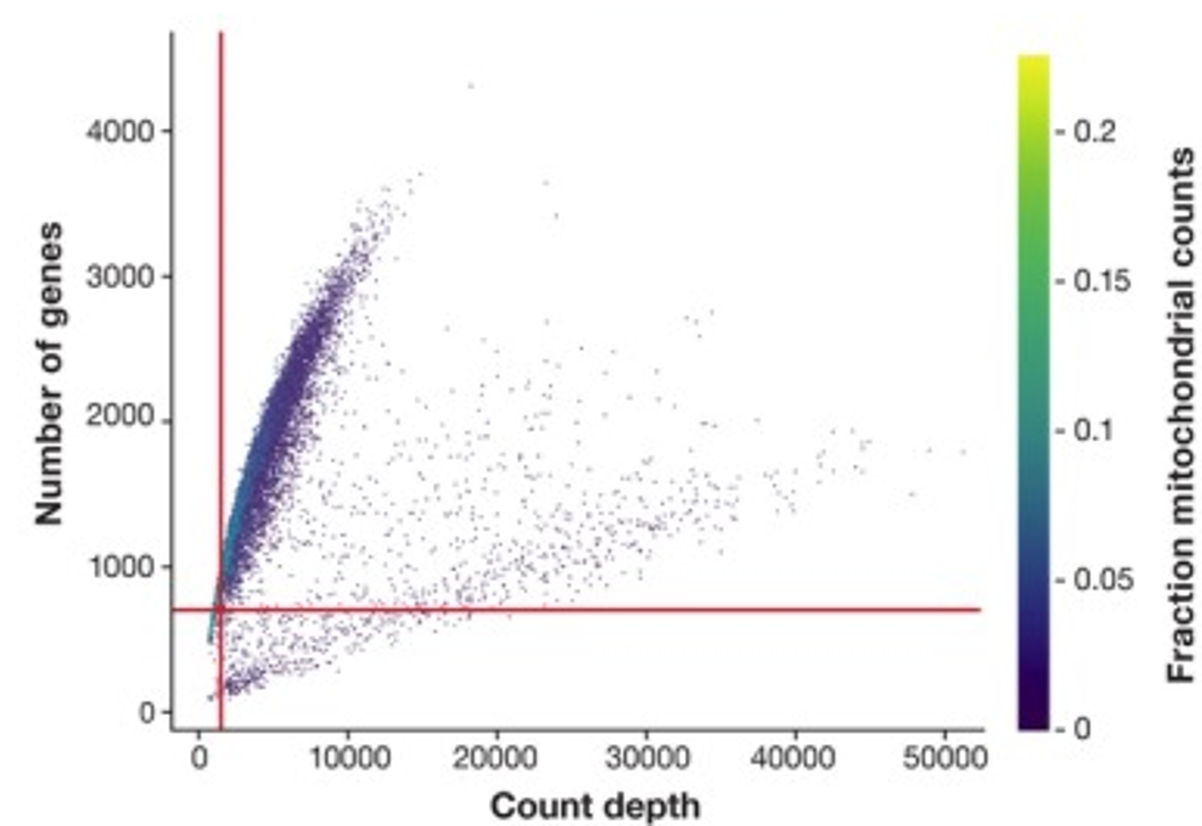
Figure 3. Combine 3 QC parameters to determine more efficient thresholds (originally Figure 2D, Luecken & Theis, (2019)
The Recommended Strategy for Setting QC Parameters
A wise strategy should be to set the parameters as permissive as possible in the beginning to avoid filtering out viable cell populations unintentionally. Then, depending on how downstream analysis performs, users can re-adjust QC parameters (Luecken & Theis, 2019). While this iterative strategy is simple and useful, users should be aware of introducing bias, forcing QC parameters to gain desirable results rather than observing the truth.
Let’s take the dataset of Cohen, et al. (2021) as an example of how this strategy works. The data contains PPIA-knocked-out RPMI-8826 cells to investigate the role of PPIA in multiple myeloma resistance. The cells were treated with carfilzomib (a proteasome inhibitor), cyclosporine (a PPIA-specific inhibitor), or their combination, along with a control (no treatment),
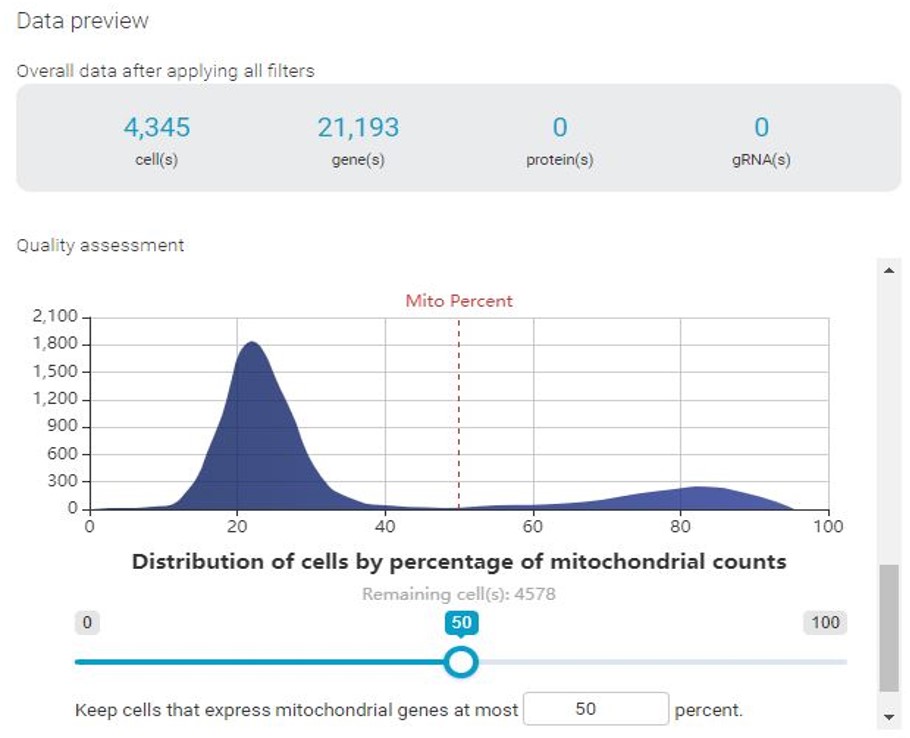
With BBrowser, users can preview the distribution of cells by the number of expressed features (i.e genes) and vice versa, and the mitochondrial count. In this specific example, we notice that there are 2 cell populations, represented by 2 peaks in all histograms.
If permissive QC thresholds were applied, the clustering result reveals a distinct cluster corresponding to cells with low genes expressed and low count depth. In this cluster, different treatment groups are not separated as clearly as the rest. Enrichment analysis reveals that this cluster is enriched with mitochondrial, indicating a high mitochondrial count. Based on these results, we can be sure that these cells are of low quality and will not contribute to further analysis, thus need to be filtered out.
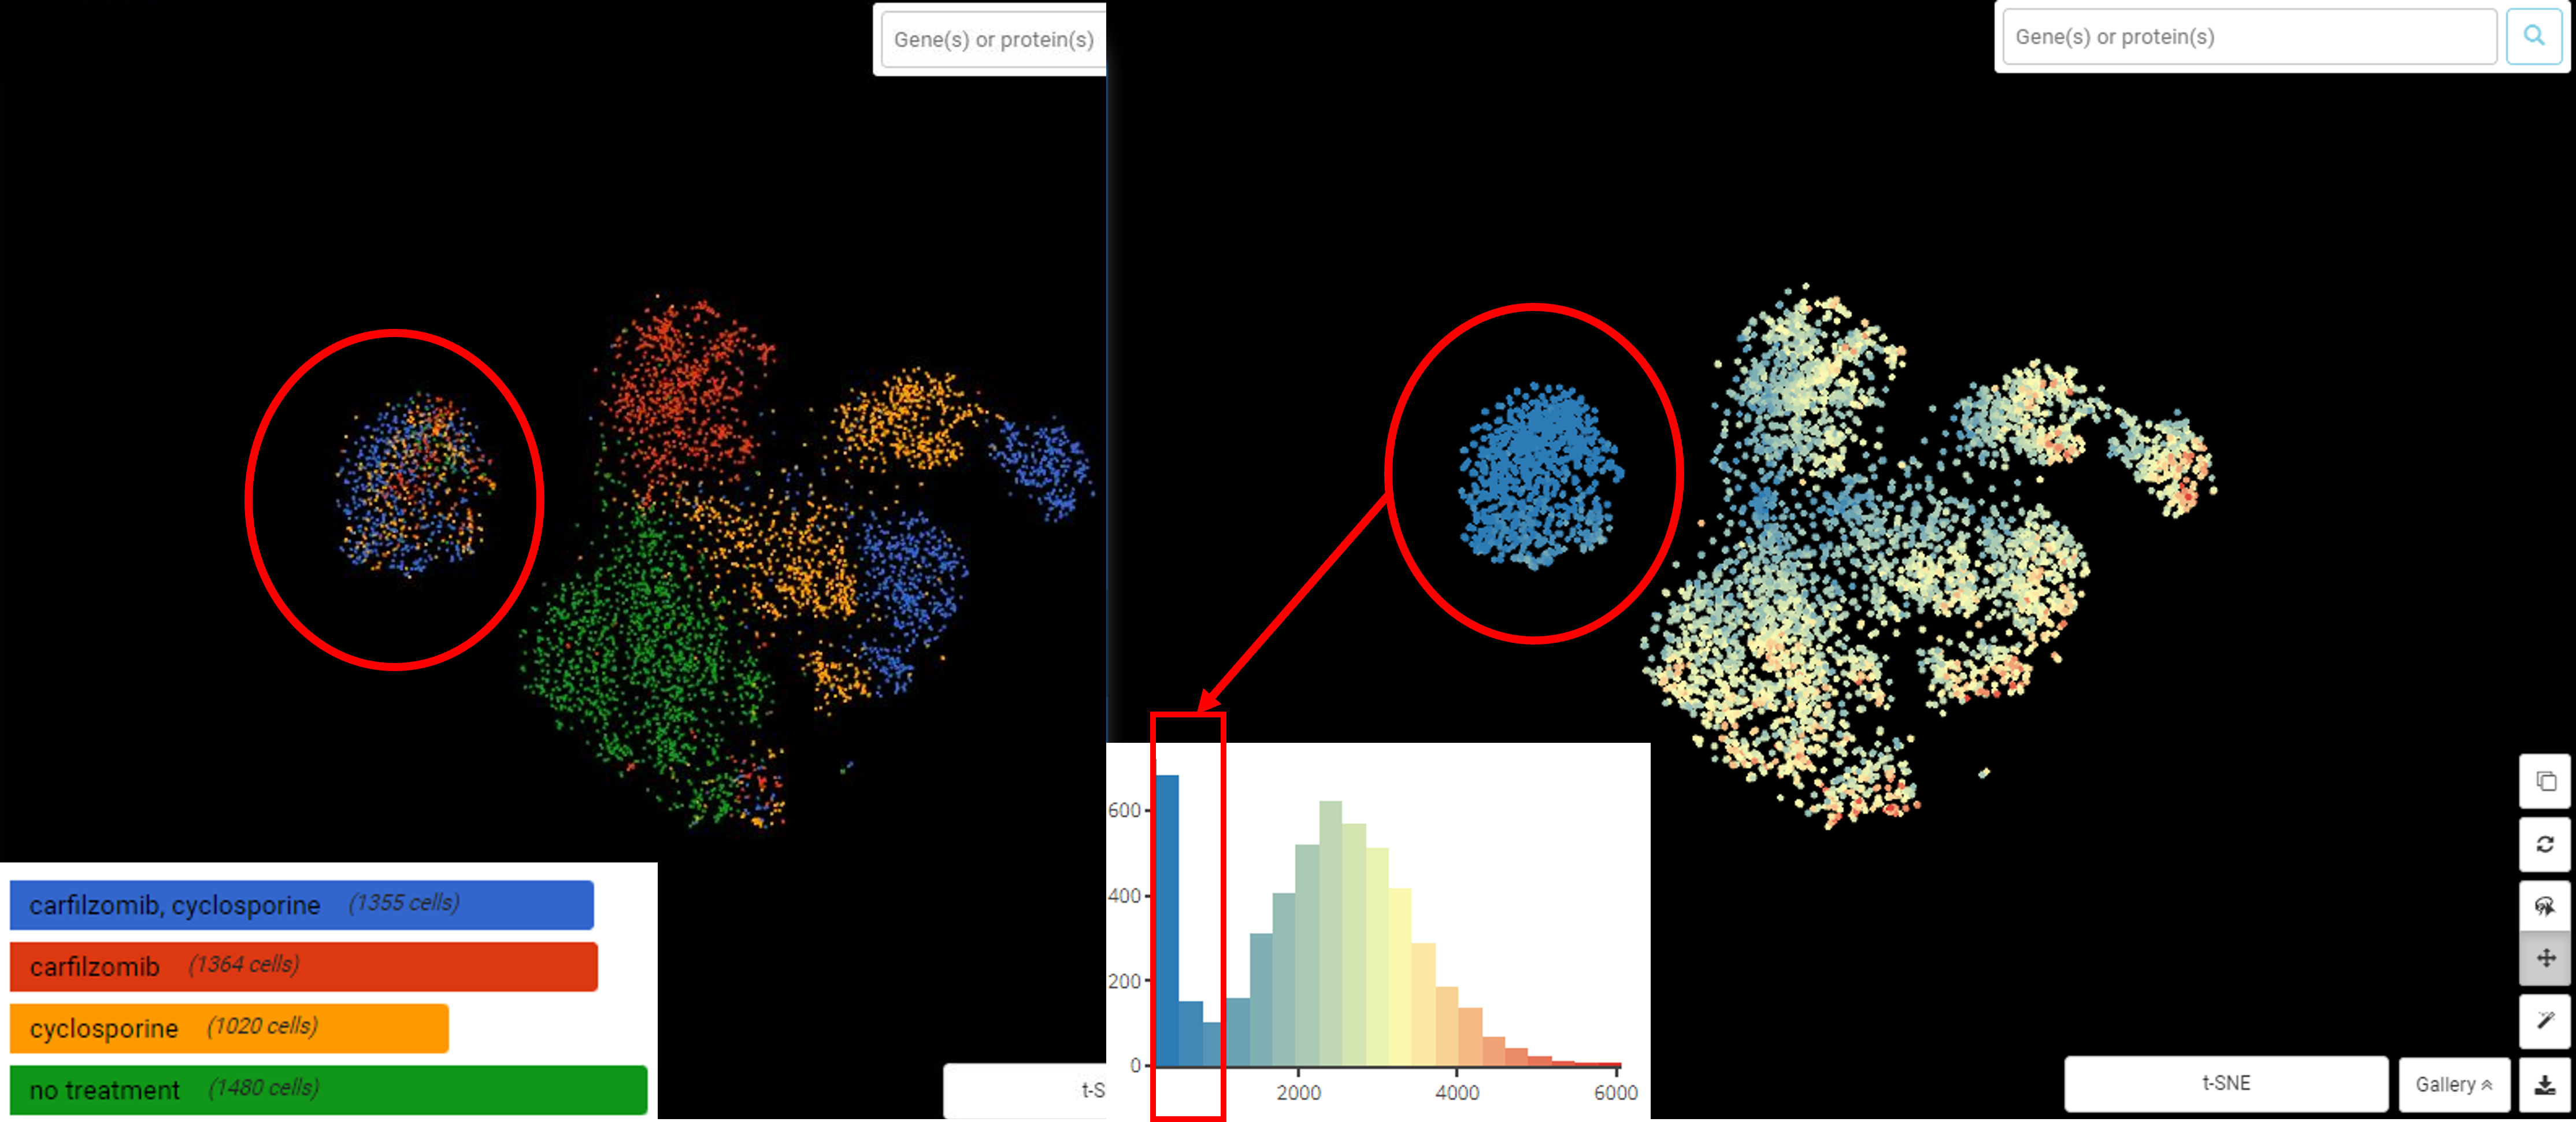
Cells with a low count depth and a low number of genes cluster together. In this cluster, treatment groups are not clearly separated as the rest of the higher quality cells
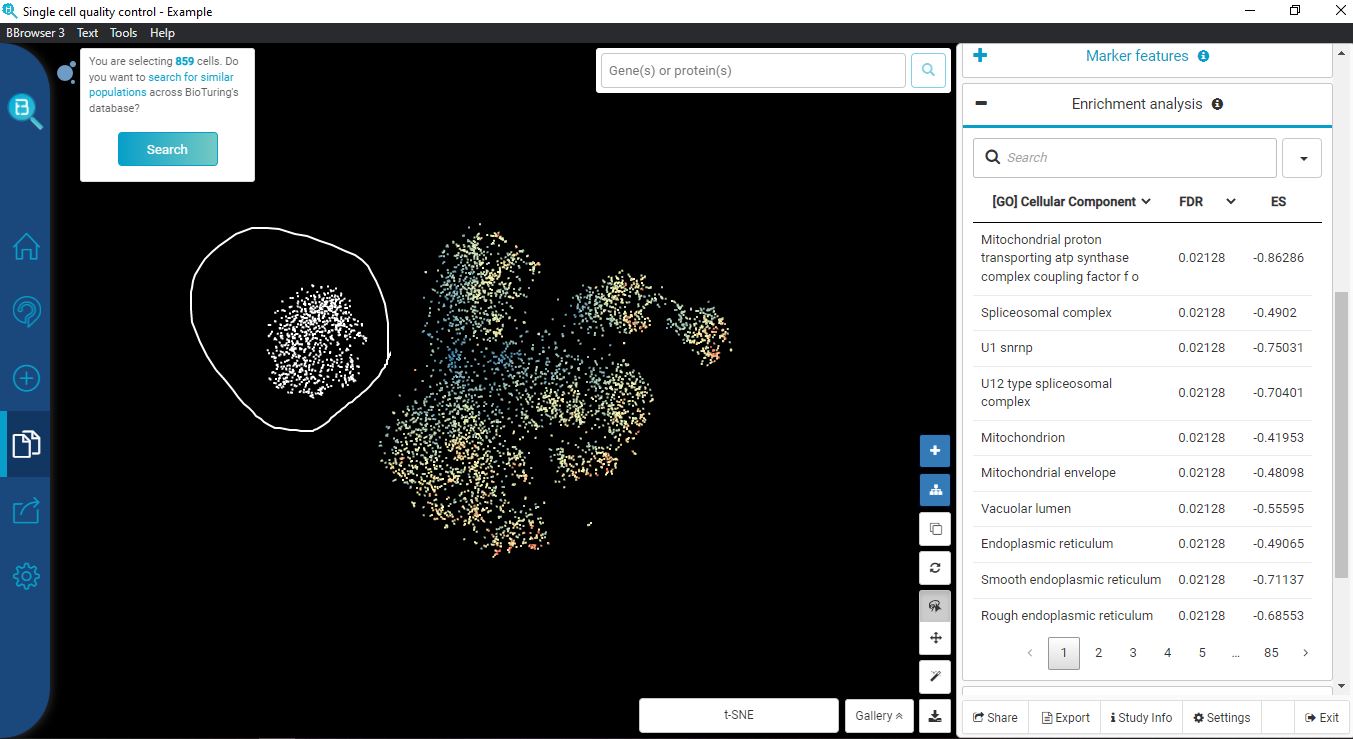
Enrichment analysis reveals this low-quality cluster is high in mitochondrial genes
With BBrowser’s analysis, we learn that these low-quality cells belong to the peak between 0-1000 genes per cell and 60% mitochondrial fraction. Now we can establish more stringent thresholds (remove cells with less than 1000 genes and more than 50% mitochondrial fraction).
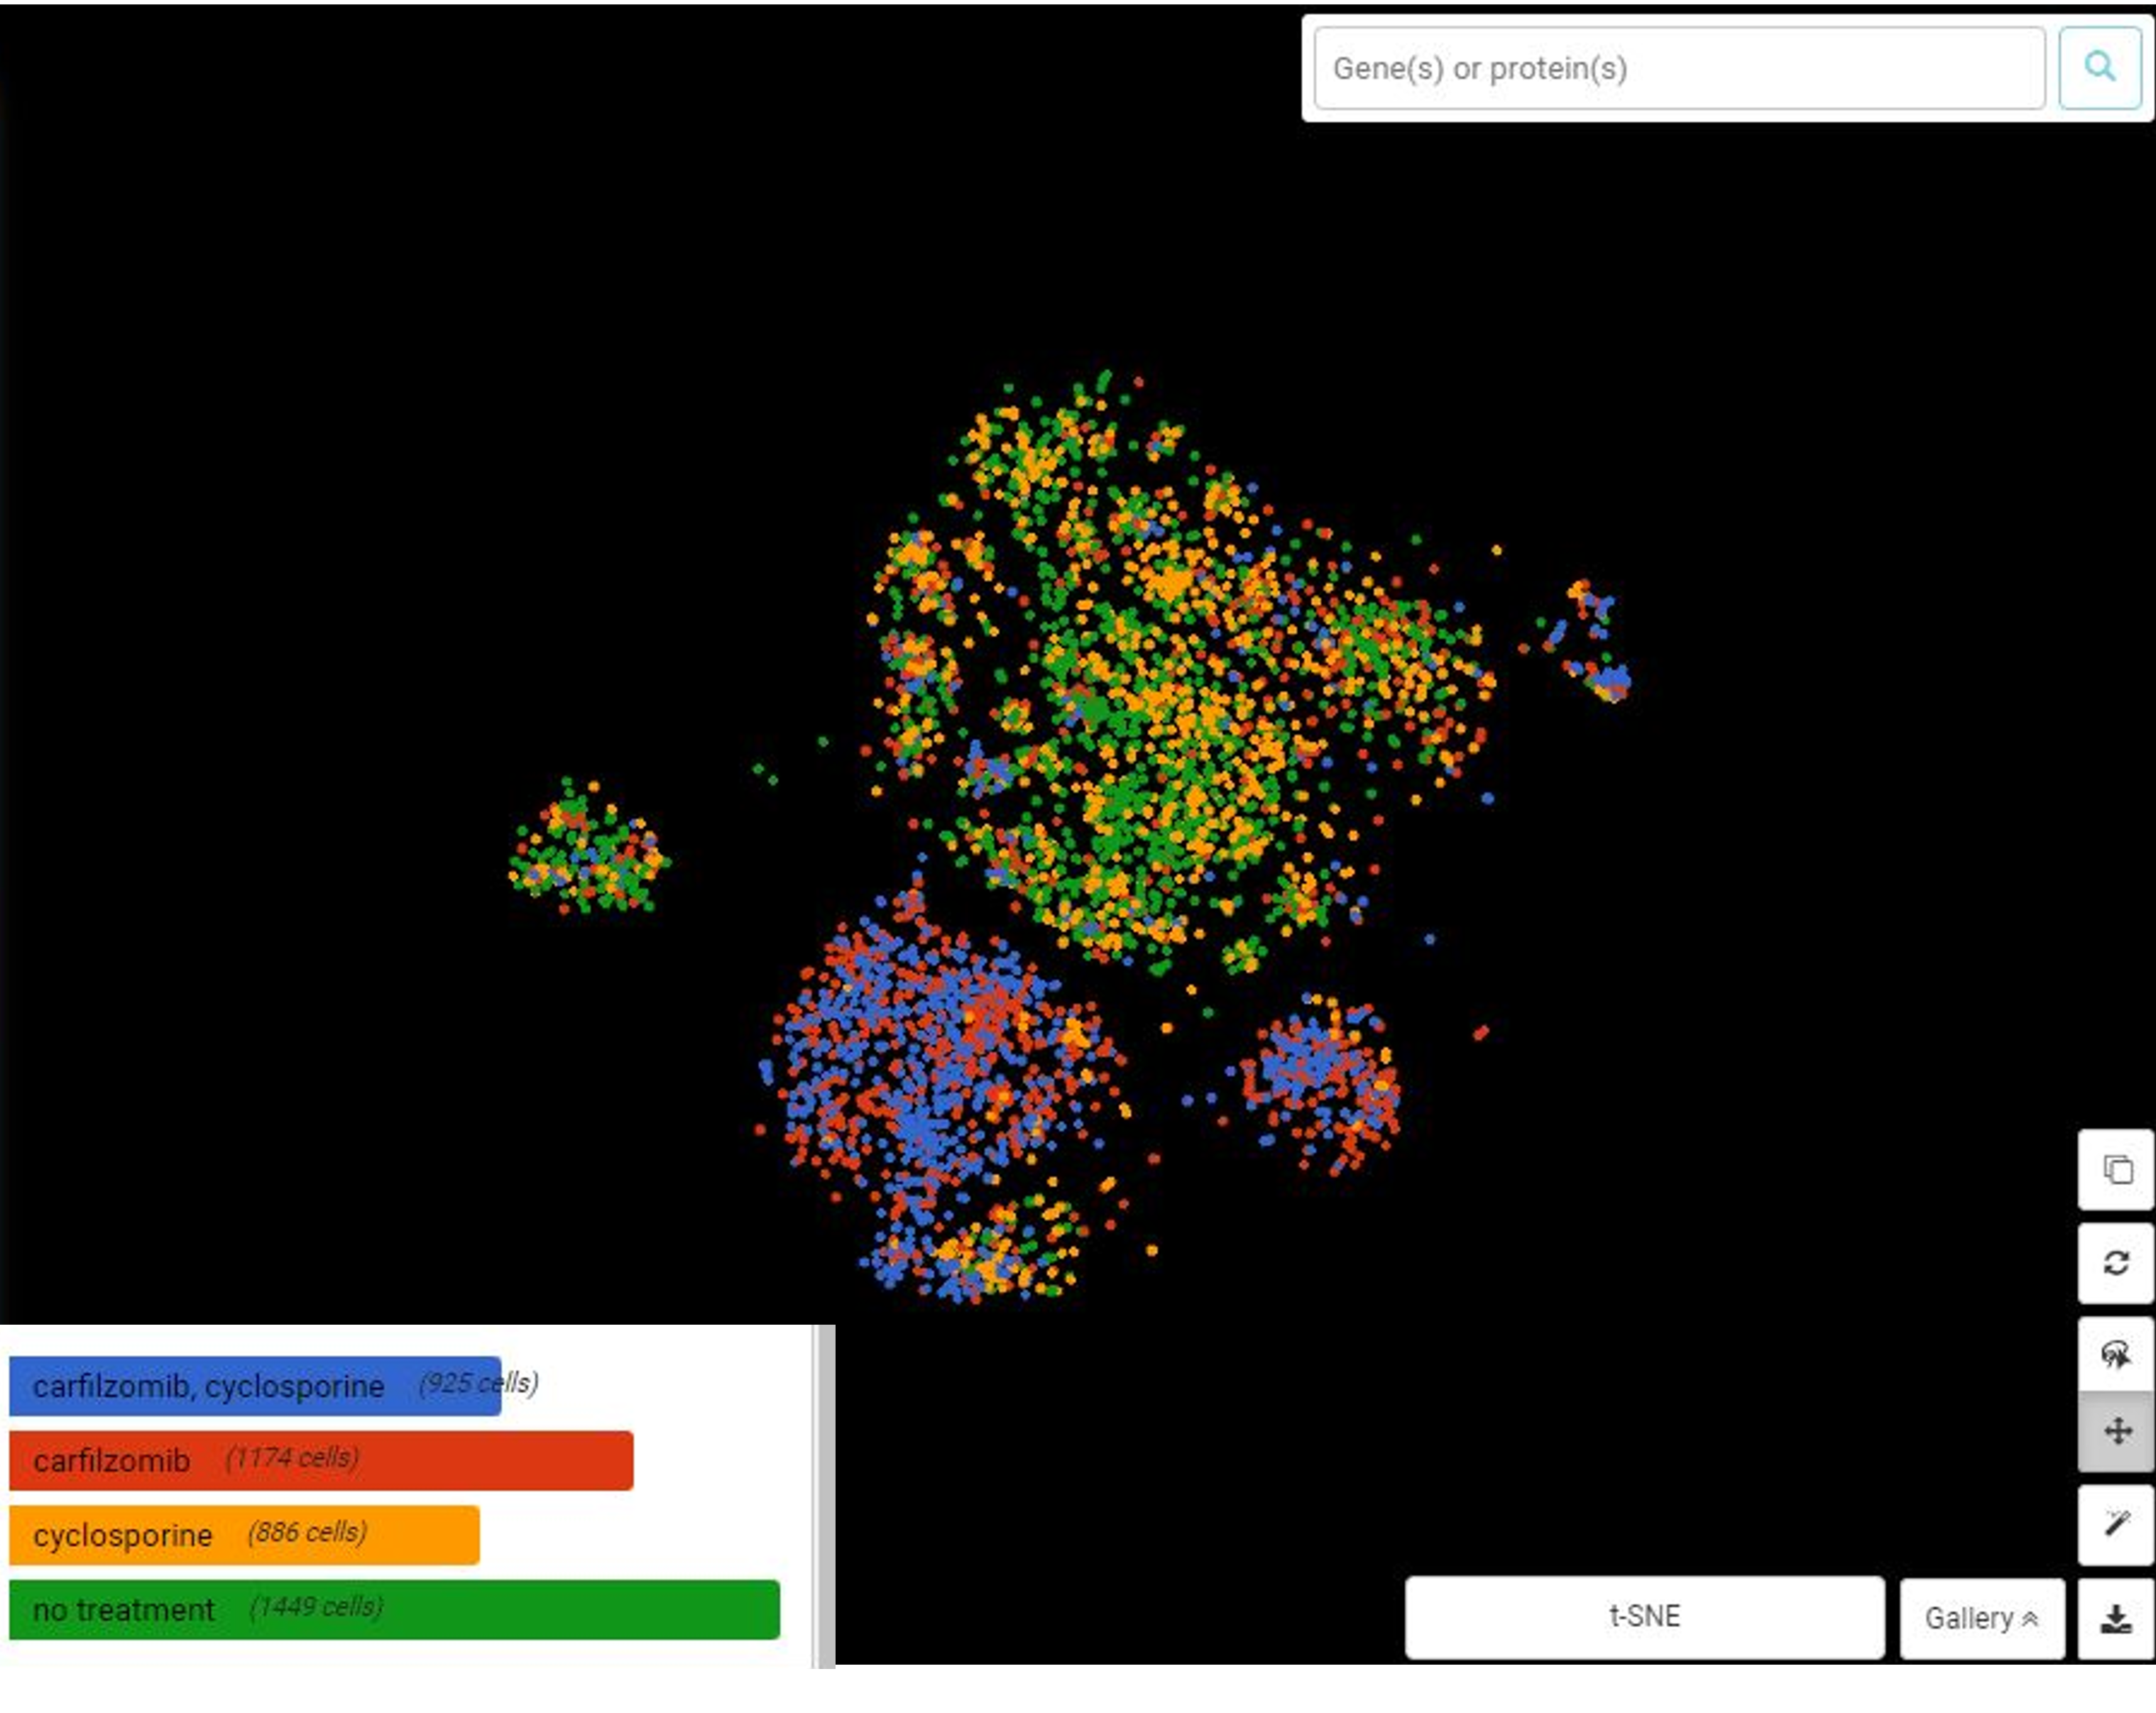
Here’s the clustering result which is consistent with the study design: ”no treatment” and “cyclosporine-treated” cells form closer clusters since cyclosporine is a PPIA-specific inhibitor, thus showing no effect on PPIA-knocked-out cells’ transcriptome. “Carfilzomib-treated” and “combined treatment” form closer clusters, probably due to the influence of carfilzomib on the transcriptome.
References:
- Ilicic, Tomislav, et al. “Classification of low quality cells from single-cell RNA-seq data.” Genome biology 17.1 (2016): 1-15.
- Lukassen, Soeren, et al. “Single-cell RNA sequencing of adult mouse testes.” Scientific data 5.1 (2018): 1-7.
- Gil, Rosario, et al. “Determination of the core of a minimal bacterial gene set.” Microbiology and Molecular Biology Reviews 68.3 (2004): 518-537.
- Mercer, Tim R., et al. “The human mitochondrial transcriptome.” Cell 146.4 (2011): 645-658.
- Osorio, Daniel, and James J. Cai. “Systematic determination of the mitochondrial proportion in human and mice tissues for single-cell RNA-sequencing data quality control.” Bioinformatics 37.7 (2021): 963-967.
- Wang, Yue J., et al. “Single-cell transcriptomics of the human endocrine pancreas.” Diabetes 65.10 (2016): 3028-3038.
- Velten, Lars, et al. “Identification of leukemic and pre-leukemic stem cells by clonal tracking from single-cell transcriptomics.” Nature communications 12.1 (2021): 1-13.
- Luecken, Malte D., and Fabian J. Theis. “Current best practices in single‐cell RNA‐seq analysis: a tutorial.” Molecular systems biology 15.6 (2019): e8746.
- Cohen, Yael C., et al. “Identification of resistance pathways and therapeutic targets in relapsed multiple myeloma patients through single-cell sequencing.” Nature medicine 27.3 (2021): 491-503.