One essential step in the preprocessing of single-cell RNA-Seq data (scRNA-seq) is batch effect correction. However, much confusion remained around this step. In this article, let’s address the most frequently asked questions about handling batch effect in single-cell RNA-Seq. .
What is Batch Effect in Single-cell RNA-Seq?
Batch effect happens when the variation in sample groups is caused by technical arrangement rather than biological factors, leading to false conclusions. From here, the need for batch effect correction arises. Batch effect correction attempts to remove technical variance when combining cells of different batches or from different studies.
But doesn’t this sound a bit similar to Normalization?
A quick reminder: scRNA-seq normalization also aims to eliminate technical noise or bias so that observed variance in gene expression variance primarily reflects true biological variance.
The types of technical noise that each step attempts to correct are different:
- Normalization targets variance from sequencing (library preparation, high dropout event, amplification bias caused by gene length GC content, etc.) (Jia et al., 2017)
- Batch effect correction targets variance from experimental designs and handling (dfferent sequencing platforms, timing, reagents, laboratories, etc.) (Haghverdi et al., 2018)
Another noteworthy difference between normalization and batch-effect removal is in the input data. Specifically, while normalization works on raw count matrix (e.g. cells x genes), most methods to remove batch effects use dimensionality-reduced data (e.g., the first 50 principle components from Principal Component Analysis) to save computation time. This means that even though the resulting batch-effect-removed result will be useful for visualization and graph-based clustering, other downstream analyses that require a full matrix of all genes (such as Differential Expression analysis) can not build up from the previous batch-effect removal process. Exceptions for this drawback are methods like Mutual Nearest Neighbor (MNN) or scGen which will output a normalized gene expression matrix with the same dimensions as the raw count table (Tran et al., 2020).
How to Detect Batch Effect in Single-Cell RNA-Seq?
While there are dedicated tools to detect batch effects, the following simple tests will suffice.
1. Dissect Principal Components
Principal Component Analysis (PCA) reveals which factor makes the most variance on your data, making it a good indicator of batch effect.
You can run PCA on raw data, then examine top principal components (PCs). You’ll know if batch effects exist when the major variations are explained by different experimental batches, rather than some biological source.
2. Examine Clusters
Similar to PCA but more visually comprehensible, clustering analysis also helps detect batch effect. Simply run clustering analysis and compare the t-SNE/UMAP plot before versus after batch correction. The hypothesis is, if batch effect exists and is left uncorrected, cells from different batches will cluster together rather than cells with biological similarities. After batch correction, there should be no such fragmentation in clusters.
Here’s an example from the dataset of Kang et al., (2018) for peripheral blood mononuclear cells (PBMCs), available at the BioTuring public database. The dataset contains 2 batches: one from Systemic lupus erythematosus (SLE) patients (batch 1), and one from controls (batch 2). Without batch correction, clusters are separated entirely by their batch origin (Figure 1). Fortunately, after applying batch correction with the Mutual Nearest Neighbor algorithm (MNN), batch effects no longer have effect on cell clustering (Figure 2).
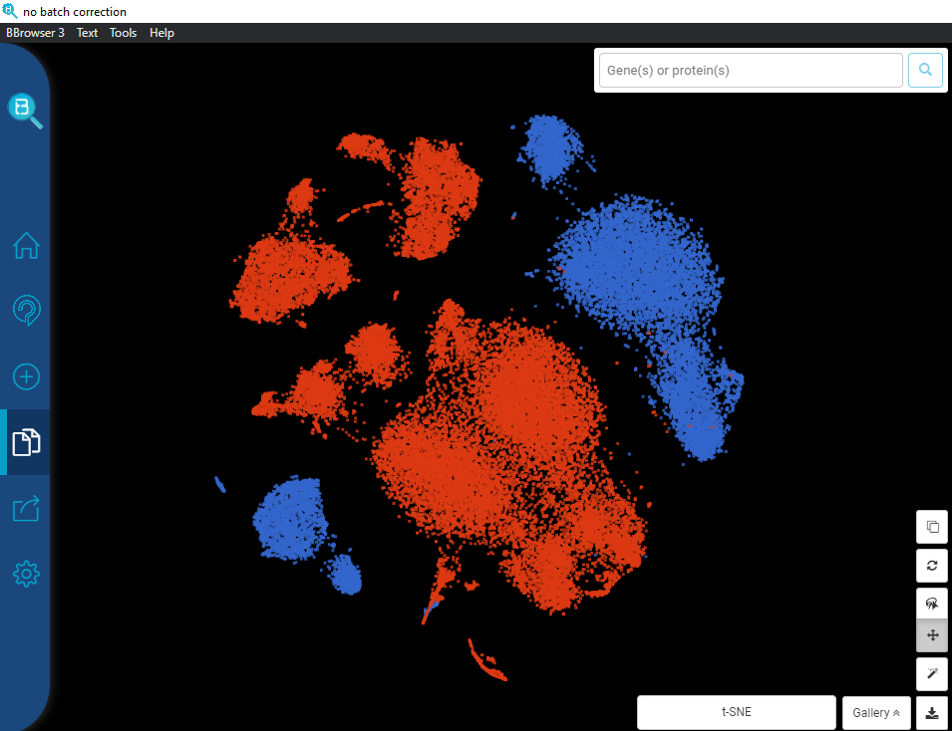
Figure 1. t-SNE plot for PMBCs (Kang et al., 2018) without batch effect correction. The clusters are color coded by batches: blue = batch 1 (patients), red = batch 2 (controls). Data processed and visualized by BBrowser
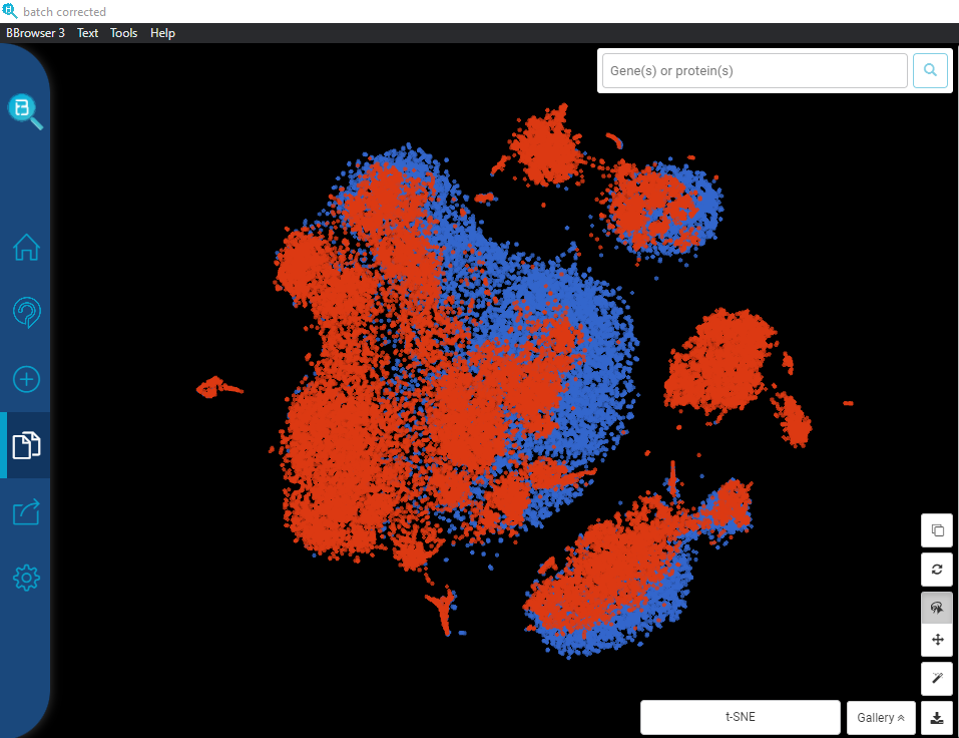
Figure 2. t-SNE plot for PMBCs (Kang et al., 2018), batch effect corrected by MNN. The clusters are color coded by batches: blue = batch 1 (patients), red = batch 2 (controls). Data processed and visualized by BBrowser
How Do You Deal With Batch Effect in Single-cell RNA-Seq?
1. Prevent potential batch effect
Since batch effects arise from experimental design and handling, the easiest solution is to make a robust experimental plan! Since even the most ideal experimental setting can only minimize potential batch effects, technical add-ons have been developed to support researchers.
One example is Cell Hashing, which barcodes each cell with oligo-tagged antibodies against highly expressed surface proteins. Another example is spike-ins, which can also help to normalize gene expression. Spike-ins are synthetic RNA sequences added to samples before sequencing and can be distinguished in downstream analysis. Measuring spike-ins is an effective way to control and regress technical variances.
2. Choose a batch effect correction algorithm
Multiple batch effect removal algorithms have been developed to date. There have also been numerous reviews comparing these algorithms, in which we recommend an excellent review from Chen et al., (2021).
In this article, we focus on three methods employed in BBrowser, namely Harmony, Mutual Nearest Neighbor (MNN), and canonical correlation analysis (CCA). These methods were developed taking into accounts the characteristics of single-cell RNA-seq data, such as the massive amount of cells and high drop-outs. This makes them superior to methods originally developed for bulk RNA sequencing and microarray.
Each algorithm differs in how they reach this goal. In particular, their principles can be explained simply as follow:
- Mutual Nearest Neighbors (MNN) (Haghverdi et al., 2018) algorithm, as its name suggests, aims to detect most similar cells between batches. Such cells are considered mutual neighbors. The algorithm assumes that they belong to the same cell type, thus the difference between them is entirely caused by batch effect. The degree of difference quantifies how strong the batch effect is. When pooling batches together, this quantification becomes the scale to merge batches.
- Seurat Canonical Correlation Analysis (CCA) (Butler et al., 2018) aims to find shared correlates structures (or canonical correlation vectors). These vectors help align cells when integrating batches.
- Harmony (Korsunsky et al., 2019) first performs Principal Components Analysis to embed cells in a low dimensional space. The algorithm investigates each cluster to find the centroids, based on which a cluster-specific correction factor is calculated. Cells are re-arranged to meet the correction. This workflow is repeated until convergence appears i.e. batch effects are removed iteratively.
The three methods were benchmarked together with 11 batch effect correction methods by Tran et al. (2020) in five different scenarios (identical cell types but different technologies, non-identical cell types, multiple batches, big data, and simulated data. While the top performance depends greatly on the type of datasets and the scenarios, overall, the authors recommended Harmony and Seurat CCA, with preference given to Harmony due to its faster runtime. It is suggested that Harmony be tried first, and if results are not satisfactory, other methods should be considered.
3. Check for Overcorrection
As with other preprocessing steps, batch effect correction can be overdone! This happens when the algorithm of choice mistakenly targets biological factors as batch effects and removes them.
How to tell if you overcorrected your data? The clearest sign is when cell populations are highly overlapped. Figure 3 and 4 shows an example of an overcorrected dataset. There are 3 cell types expressing either Neuronal ceroid lipofuscinoses (NCL) protein, Chromogranin A or parathyroid secretory protein 1 (CHGA), or both. When batch effect correction is applied and seemingly overdone, batches completely overlap and cell types can’t be distinguished.
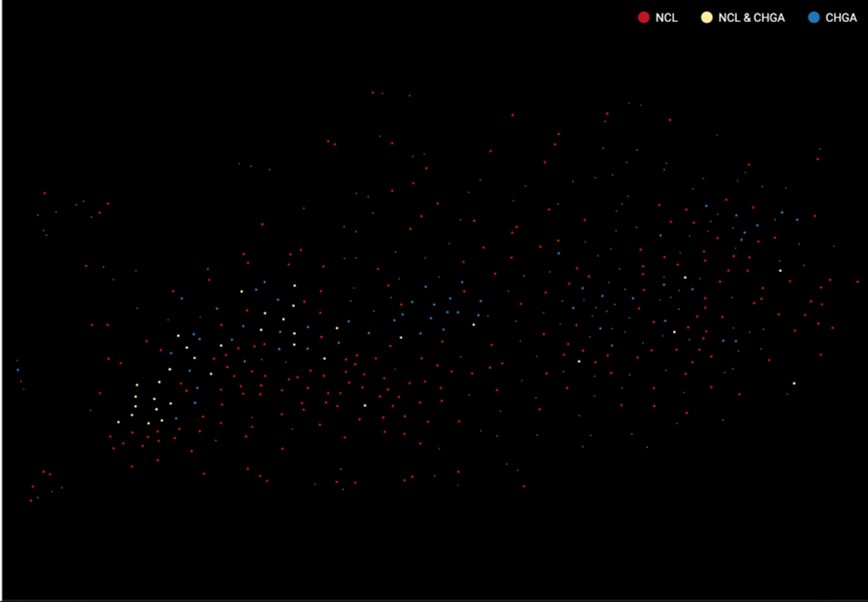
Figure 3. Batch effect overcorrection makes different cell types completely overlapped
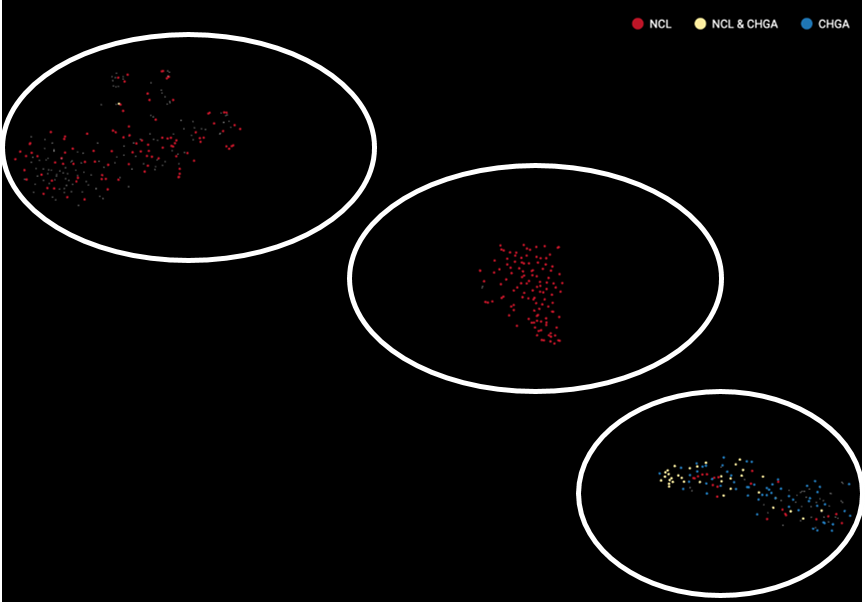
Figure 4. No batch effect correction maintains the biological distinction.
If this is the case, consider trying a different batch correction method that is less aggressive on data fitting. You should also consider if batch correction is necessary at all, especially if the aforementioned PCA and/or clustering test shows that batch effects cause negligible variation.
There have been some tools specifically designed to detect batch effects and evaluate the correction. Despite complicating the analysis pipeline, these tools are worth trying if batch effects removal is a must. For instance, Büttner et al. (2019) developed a quantitative test for batch effect correction called kBET (short for k-nearest-neighbor batch-effect test). The tool is as user-friendly as the PCA and clustering check above as it provides one metric: the rejection rate. Put simply, kBET tests on data subsets to see if batch labels are distributed differently i.e some subsets contain more cells from one batch than the other (Figure 5).
An equally effective metric is the local inverse Simpson’s index (LISI) (Korsunsky et al., 2019). Each metric has their pros and cons; the application is heavily influenced by the nature of the dataset. For instance, according to the authors of LISI, kBET’s statistical tests will be problematic when a dataset contains very different cell types. Meanwhile, LISI’s major drawback is batches with very different sizes.
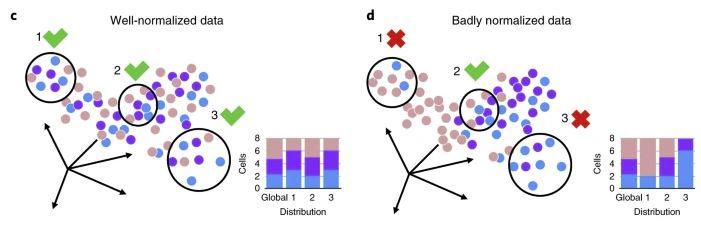
Figure 5. The principle of kBET. In a well-normalized, well-corrected dataset, in most subsets, batch labels are distributed similar to the whole dataset, thus getting a low rejection rate. In contrast, if batch labels’ distribution among subsets differs from the global pattern, kBET assigns a high rejection rate. Originally figure 1c and 1d (Büttner et al., 2019)
Closing
At the end of the day, what constitutes unwanted noise to be removed and what qualifies as a biologically interesting difference, even in the same dataset, really depends on the question researchers are trying to answer based on the obtained data. For example, a study consisting of male and female subjects having the same disease will often have gender-specific clusters when visualized with t-SNE or UMAP. In this case, a researcher who does not want to have gender identity obscuring disease-related signals will correctly choose to define ‘gender’ as batch effect to be removed. Yet it is also reasonable to hypothesize that there might be an interaction effect between ‘gender’ and ‘disease status’, thus carrying out batch-effect removal for ‘gender’ here might be undesirable.
To account for this, BBrowser offers the flexibility to run batch effect removal even after a study has been submitted based on a categorical metadata, helping users to freely choose what they want to consider as ‘batch effect’, rather than having to always stick with the narrow definition of batch effect based on the original experimental setup.
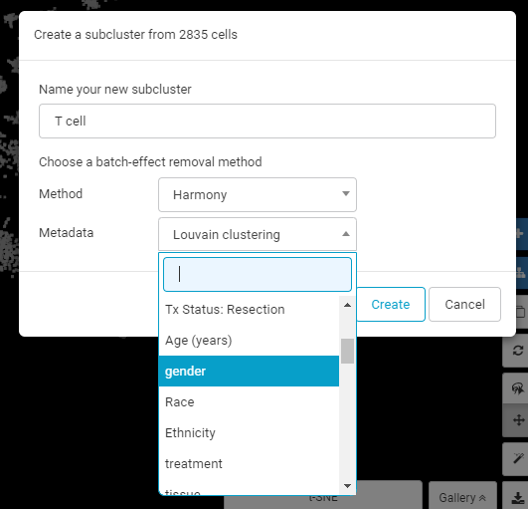
Choose what constitute as ‘batch effect’ for your specific needs with BBrowser
While there have been many excellent algorithms to handle batch effects in single-cell RNA-seq, they have just solved one part of the problem – correcting batch effects in the same study. The challenge remains in data integration. To completely remove batch effects between studies, where experimental designs and handling vary greatly, is an impossible mission for the moment. However, with the great demand for integration and cross-analysis, a more advanced batch correction algorithm is currently an attractive topic.
To help users understand more about Harmony – one of the most commonly used batch effect correction for scRNA-seq, we organized a webinar with Harmony’s creator – Dr. Ilya Korsunsky. Watch here!
References:
- Jia, C., Hu, Y., Kelly, D., Kim, J., Li, M., & Zhang, N. R. (2017). Accounting for technical noise in differential expression analysis of single-cell RNA sequencing data. Nucleic acids research.
- Kang, H. M., Subramaniam, M., Targ, S., Nguyen, M., Maliskova, L., McCarthy, E., … & Ye, C. J. (2018). Multiplexed droplet single-cell RNA-sequencing using natural genetic variation. Nature biotechnology, 36(1), 89-94.
- Chen, W., Zhao, Y., Chen, X., Yang, Z., Xu, X., Bi, Y., … & Wang, C. (2021). A multicenter study benchmarking single-cell RNA sequencing technologies using reference samples. Nature Biotechnology, 39(9), 1103-1114.
- Haghverdi, L., Lun, A. T., Morgan, M. D., & Marioni, J. C. (2018). Batch effects in single-cell RNA-sequencing data are corrected by matching mutual nearest neighbors. Nature biotechnology, 36(5), 421-427.
- Butler, A., Hoffman, P., Smibert, P., Papalexi, E., & Satija, R. (2018). Integrating single-cell transcriptomic data across different conditions, technologies, and species. Nature biotechnology, 36(5), 411-420.
- Korsunsky, I., Millard, N., Fan, J., Slowikowski, K., Zhang, F., Wei, K., … & Raychaudhuri, S. (2019). Fast, sensitive and accurate integration of single-cell data with Harmony. Nature methods, 16(12), 1289-1296.
- Büttner, M., Miao, Z., Wolf, F. A., Teichmann, S. A., & Theis, F. J. (2019). A test metric for assessing single-cell RNA-seq batch correction. Nature methods, 16(1), 43-49.
Bioinfographer
Great Article! Very interesting faq’s