Single-cell RNA sequencing (scRNA-seq) unfolds biological processes at individual cell resolution. One key step that makes up the power of scRNA-seq is the spotting of differentially expressed (DE) genes. However, characteristics like high heterogeneity and data sparsity (high zero counts) are the main obstacles in finding DE genes in scRNA-seq data.
These challenges gave rise to a plethora of DE analysis tools. According to the scRNA-tools database, at the moment of writing, there have been over 1,200 tools dedicated to scRNA-seq data analysis, of which 130 tools are for DE analysis.
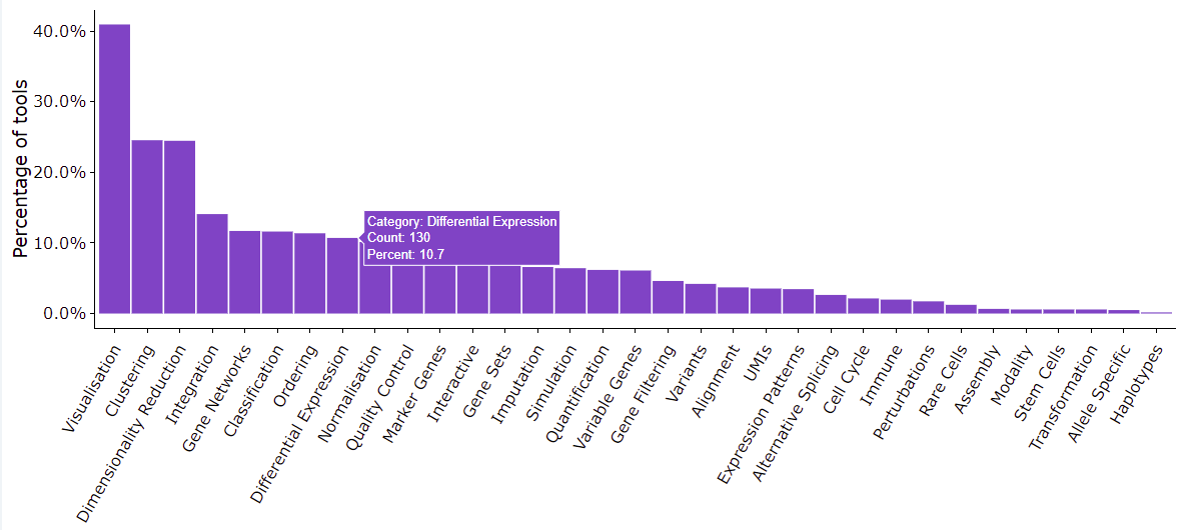
The maze of scRNA-seq DE analysis tools
The vast number of available tools and their wildly different working principles make it difficult for researchers to pick the right one. Furthermore, there’s little agreement between tools in detecting DE genes (Wang et al., 2019). Many benchmarking studies have reached an unanimous conclusion: it’s impossible to find the best performing tool in DE analysis and the performance of a DE analysis tool is very data-specific (Das et al, 2021, Dal Molin, Alessandra, Giacomo Baruzzo, and Barbara Di Camillo, 2017,Wang et al., 2019).
So, are we left to get lost in the maze of scRNA-seq DE analysis tools? Let’s not despair. While there’s no best performer, we can enjoy a wide range of options that, if carefully chosen based on our data characteristics, still bring out optimal results.
In this article, we’ll summarize several comparative studies on scRNA-seq DE analysis tools, in hope of providing you an escape out of this maze.
Classify ScRNA-Seq Differential Expression Analysis Tools
According to Das et al, (2021), each differential expression analysis tool’s performance depends on several factors, with the most critical ones are:
-
- the characteristics of the dataset in question, such as the multimodality of gene expression and the level of zero inflation.
- Multimodality: gene expression in scRNA-seq may follow a multimodal distribution. Several studies suggest that gene expression varies between single cells. For instance, the gene expression of cells from the same tissue can differ due to cell types, cellular activities, or drug treatment. This phenomenon is often referred to as “data multimodality” (Wang et al., 2019).
- Zero inflation: means that the proportion of zero counts exceeds the expected count distribution. Compared to bulk RNA sequencing, scRNA-seq suffers from very high zero gene expression values (10-40% in bulk RNA sequencing versus up to 90% in scRNA-seq). This great sparsity makes comparing gene expression challenging. This term is often used interchangeably with “dropout” and “excess zeros”,but the most unambiguous term is zero inflation (Jiang, et al., 2022)
- the statistical models that are utilized to fit the data: either parametric (assuming that the data fit a certain count model) or non-parametric (requiring no such assumption). In general, non-parametric methods are less stringent and thus applicable to more datasets, but parametric methods hold superior statistical power.
- the method-specific statistic test to identify DE genes.
- the characteristics of the dataset in question, such as the multimodality of gene expression and the level of zero inflation.
Based on these considerations, current popular DE analysis tools can be classified as in Figure 1.
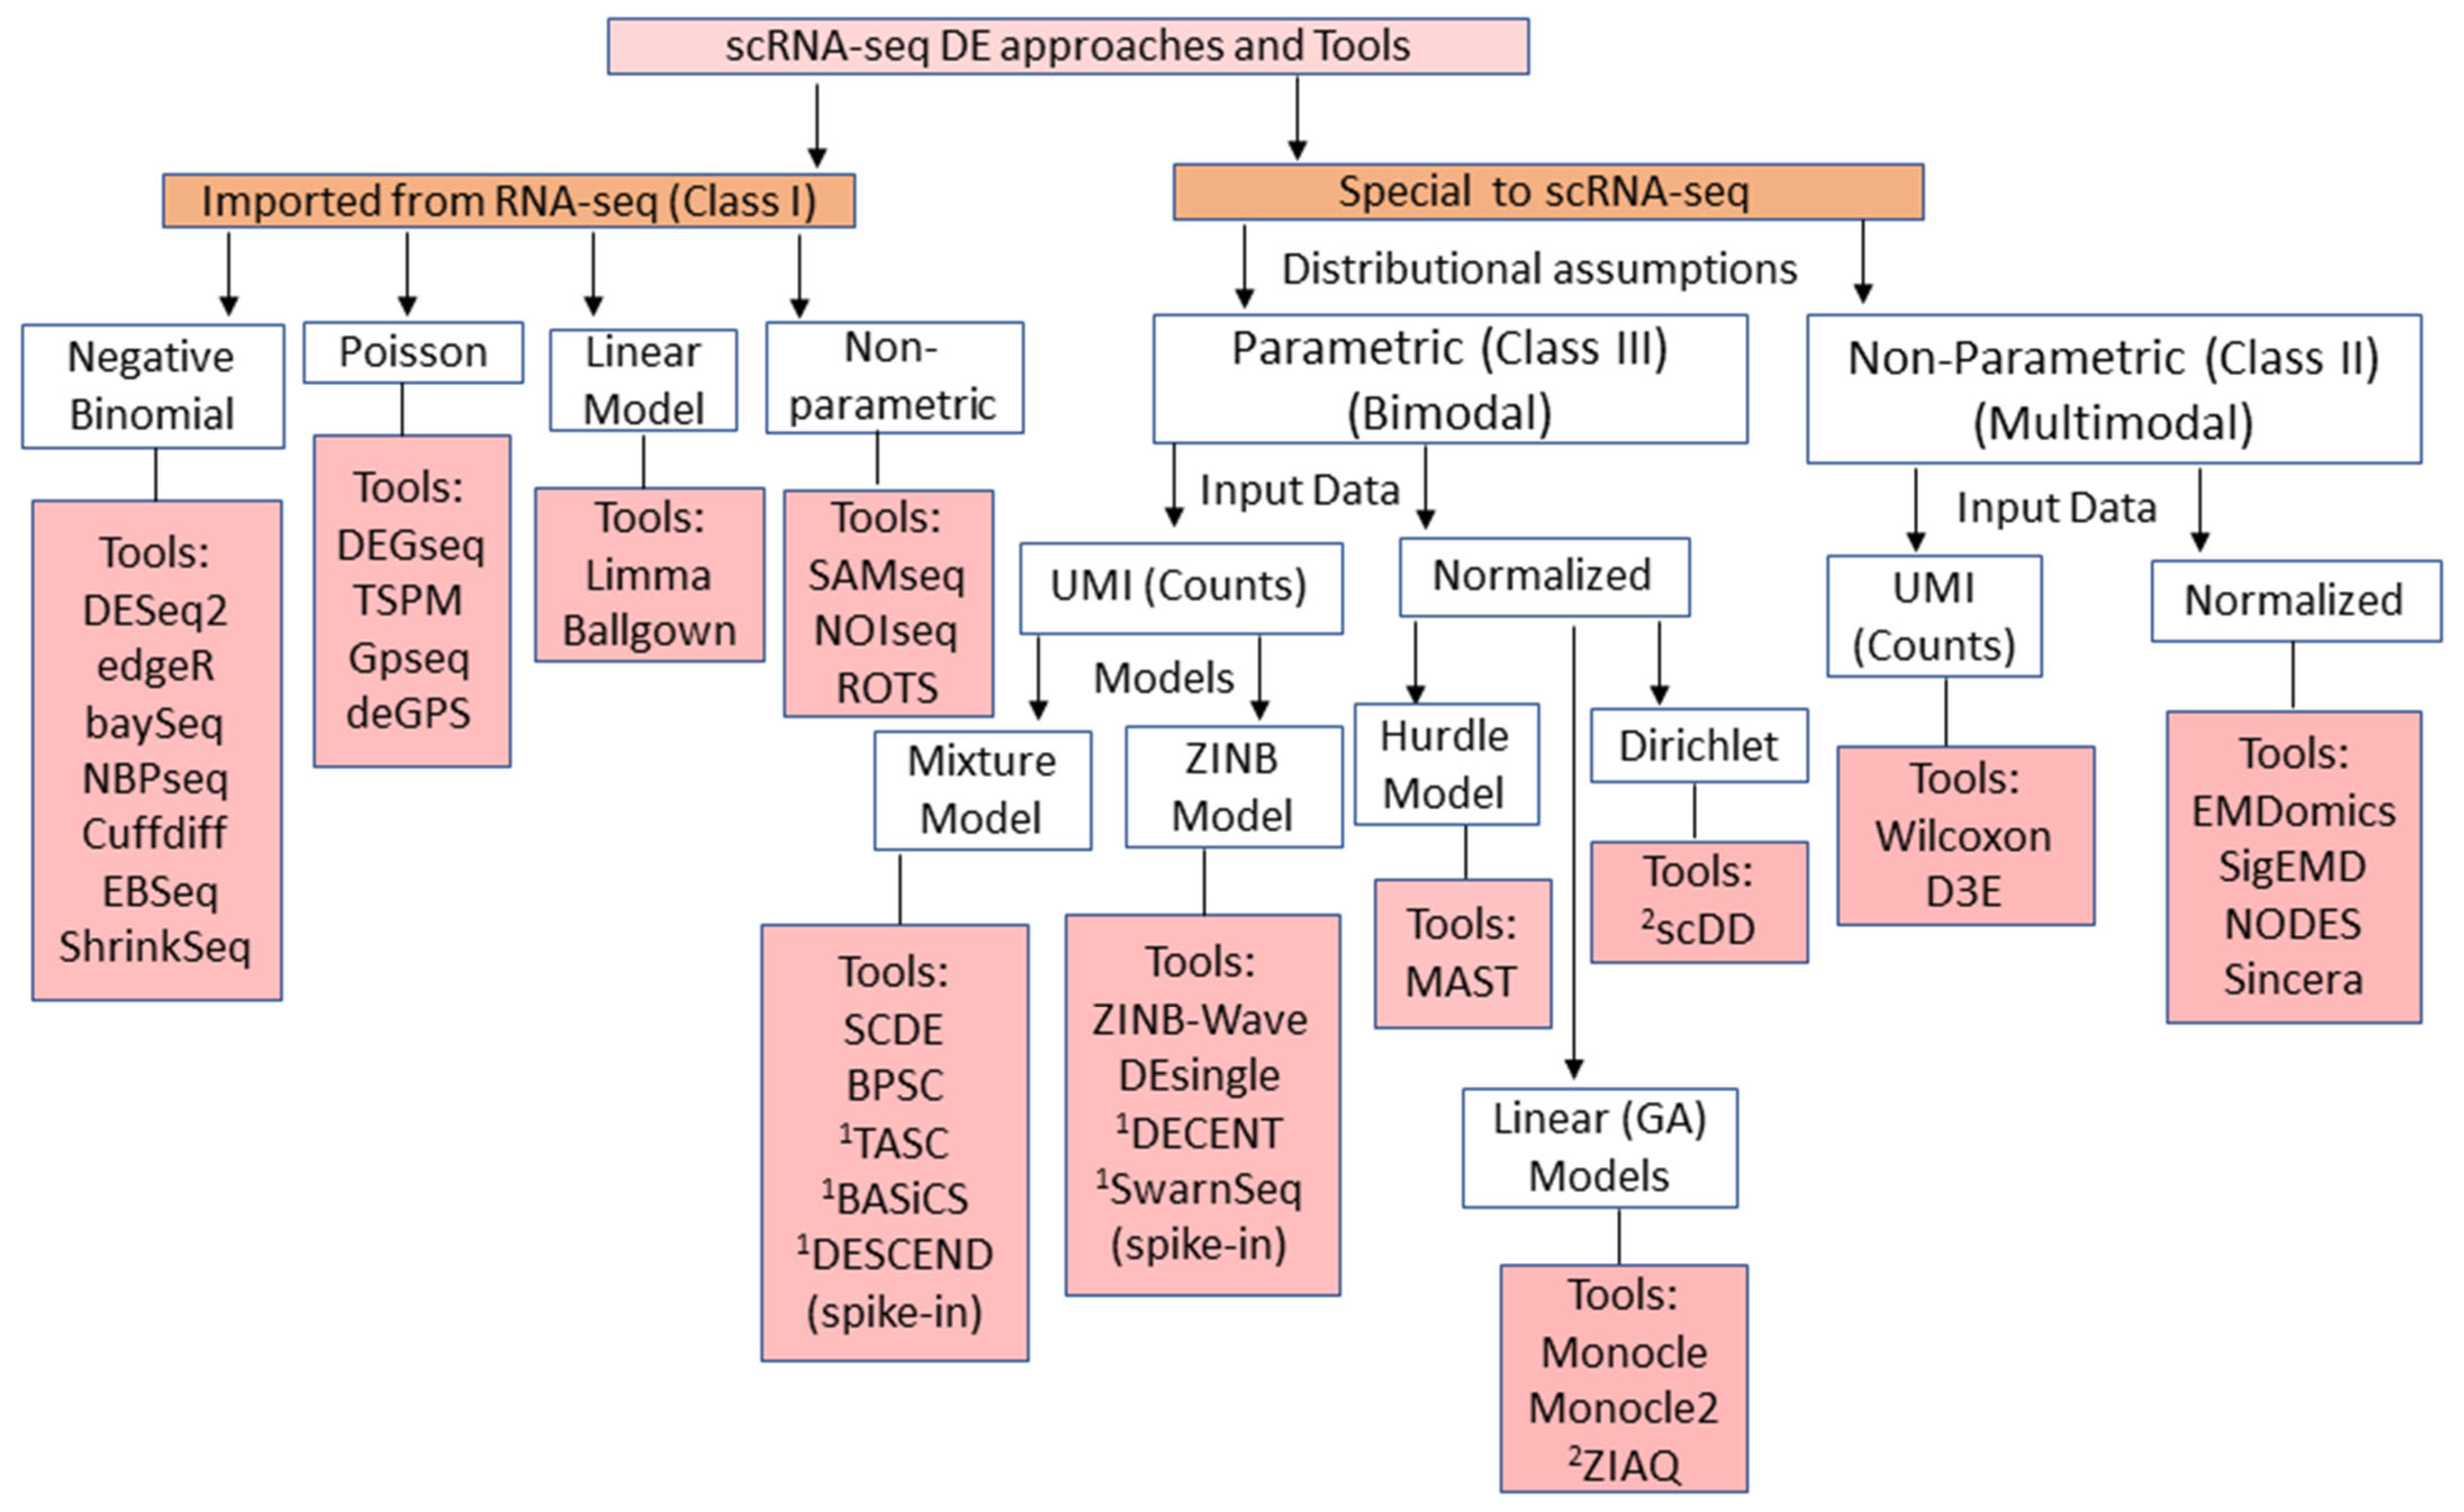
Figure 1. A schematic classification of available, widely used scRNA-seq DE analysis tools. (originally Figure 1, Das et al, 2021)
In the same study, the authors also provided a quick chart to summarize the features of each class, along with their features and limitations (Table 1).
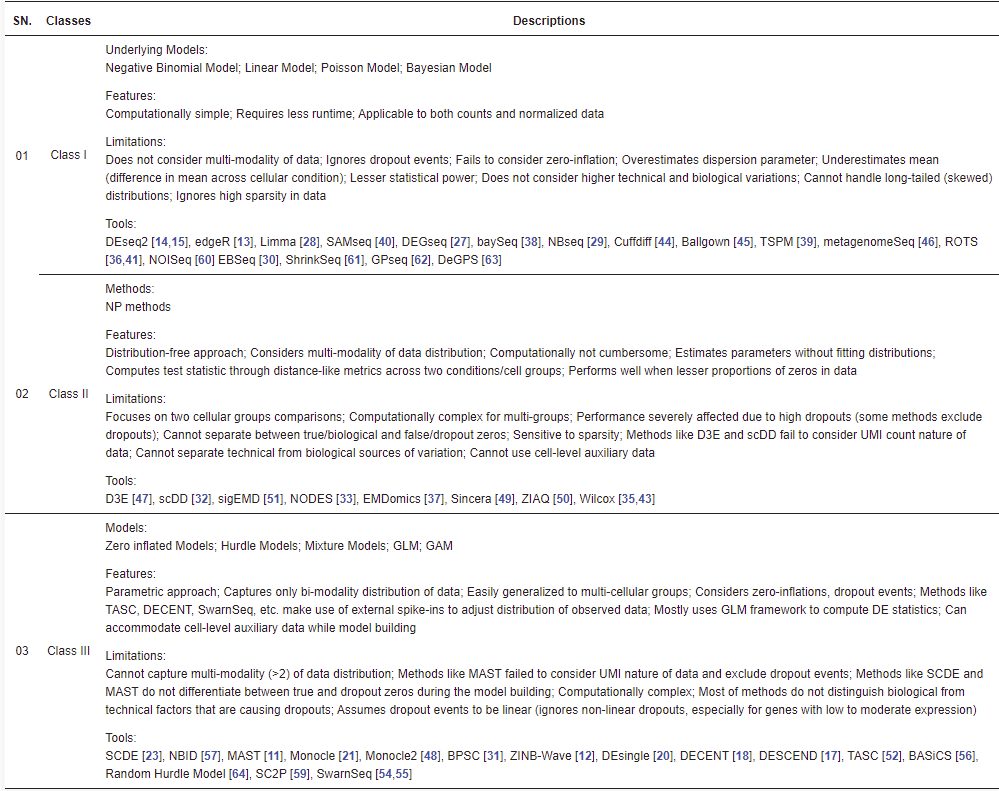
Table 1. Summary of the features and limitations of widely used scRNA-seq DE analysis tools. (originally Table 2, Das et al, 2021). Class I = Methods adapted from bulk RNA-seq, Class II = Methods developed for scRNA-seq and use parametric approach, Class III = methods developed for scRNA-seq and use non-parametric approach
Simplify The Maze: The Most Used ScRNA-Seq Differential Expression Analysis Tools
The growing number of DE analysis tools is intimidating, but not all tools gain researchers’ trust. The options have been greatly narrowed down, fortunately, since only a small number of tools are being used by the majority of researchers. According to Squair et al., (2021), in 500 latest scRNA-seq studies, only 11 methods made up to over 80% of DE analysis, with the Wilcoxon rank-sum test being the most popular choice (Figure 2). Nevertheless, bear in mind that popularity doesn’t always guarantee success.
Out of the top 11 tools, 4 are available in BBrowser, namely Wilcoxon, DESeq2, t-test, and Likelihood ratio test. We also develop Venice, a non-parametric method with an out-of-the-box approach in finding DE genes.
In short, conventional approaches aim to find up/down-regulated genes, which works well if the gene expression pattern follows a unimodal distribution. In such distributions, the mean expression value will be a reliable metric to distinguish up/down-regulated genes.
However, in scRNA-seq data, due to cell heterogeneity, gene expression cannot always be distinguished as up/down-regulated. In other words, the gene expression may follow a multimodal distribution. This multimodality is the main challenge in finding DE genes in scRN-seq data.
Earlier methods (DESeq2, limma, etc.) try to fix the problem by fitting/normalizing the multimodal gene expression into single-modality. In contrast, Venice uses multimodality as a metric: when comparing gene expression from 2 groups of cells, the algorithm divides cells in each group into quantiles based on their expression values. A gene is up-regulated if its expression in group 1 is higher than group 2 for every quantile (and vice versa for down-regulated genes). Genes that do not fit into this metric are called “transitional markers” – their expressions are higher for some quantiles and lower in some other quantiles. In a benchmarking study, Venice’s performance outcompeted 14 other tools (Vuong et al., 2020) (e.g Figure 3).
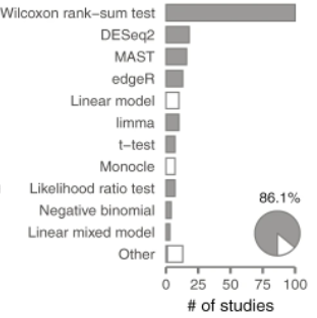
Figure 2. 11 DE tools account for over 80% of latest scRNA-seq studies (originally Figure 1b, Squair et al., 2021)
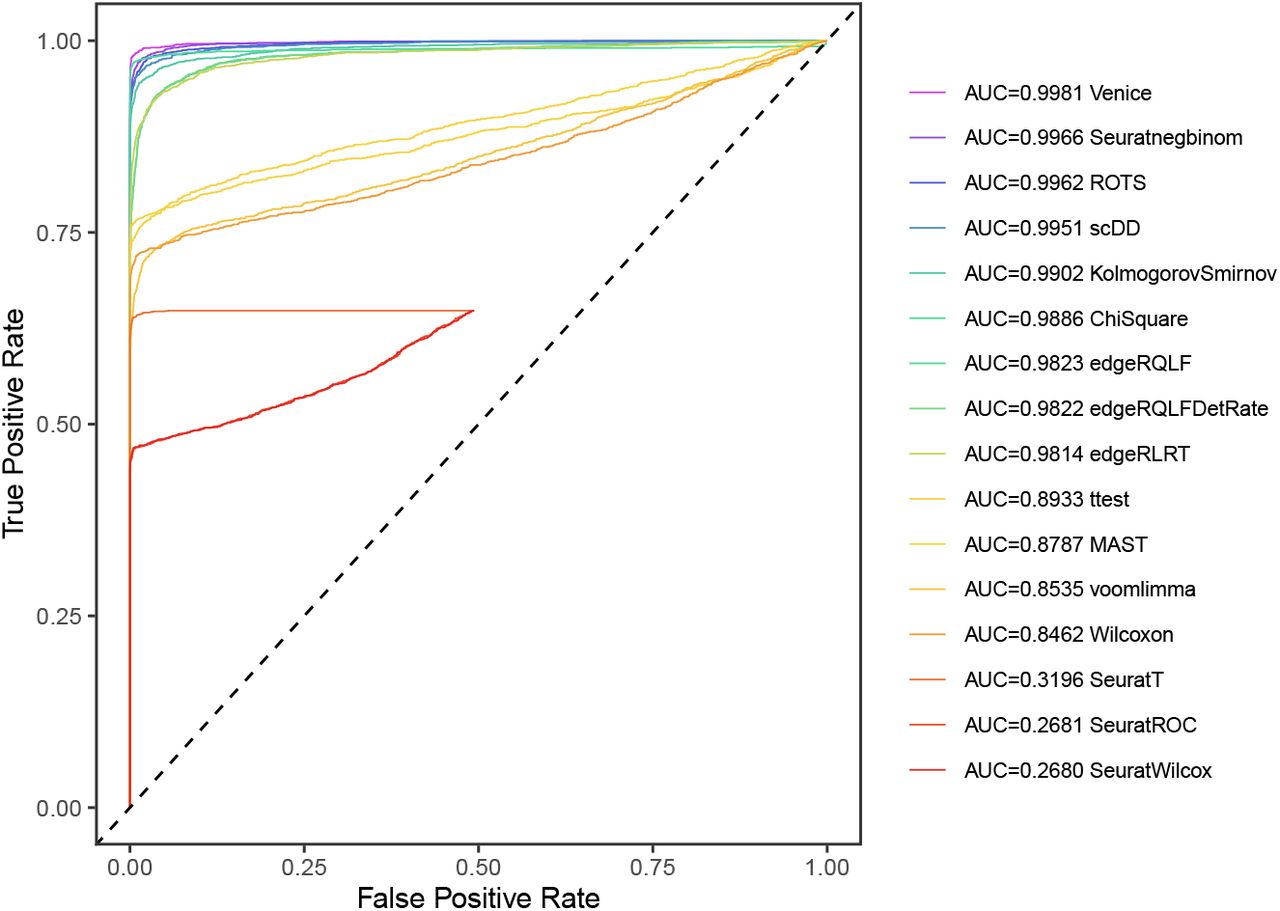
Figure 3. Venice has the best receiver operating characteristic curve out of 16 different DE tools, tested on a simulated dataset for typical gene expression patterns (originally Figure 2, Vuong et al., 2020)
Some Noteworthy Conclusions from Comparative Studies
1. Data size
In Das et al, (2021) study, the number of cells tested and even the number of cells per group can significantly affect the DE analysis’s performance. In general, the number of DE genes and true positive rate tend to increase as the sample size increases (Wang et al., 2019).
However, a larger sample size doesn’t always mean better sensitivity. For example, for a sample size of fewer than 600 cells, read count-based Negative Binomial tools (edgeR, DESeq, etc.) perform generally better compared to a sample size of >2000. In contrast, UMI-based tools, like DECENT, or normalized data-based LIMMA, require a large enough sample size to run effectively (over 1000 cells).
2. Multimodality and Zero counts
In bulk RNA-sequencing, a gene’s expression is the mean expression of all cells in the sample. However, in scRNA-seq, the expression of one gene can vary from cell to cell, creating the multimodal expression pattern. Most methods developed for scRNA-seq focus on solving this multimodality, along with zero inflation. Unfortunately, they can only deal with either zero counts or multimodal expressions, but not both (Wang et al., 2019).
For this factor, the rules of thumb are:
- The lower the multimodality is, the better the performance (Wang et al., 2019, Dal Molin, Alessandra, Giacomo Baruzzo, and Barbara Di Camillo, 2017). This also applies to zero counts.
- Methods that account for multimodality tend to work better than methods that tackle zero inflation.
- For highly multimodal data, tools that account for individual genes (DESeq2, EMDomics, Monocle2, etc.) achieve higher true positive rates.
3. The Risk of False Positive From Biological Replicates
According to Squair et al., 2021, many popular tools can be misleading if they ignore the variation between biological replicates. The study found that within the same experimental condition, replicates can still differ due to technical variation. This will become the source of false positives DE genes. In summary, the authors observed that:
- Methods that pool cells before applying the DE test, such as DESeq2, edgeR, limme, etc., account for the technical variation between replicates, thus producing more accurate results.
- In contrast, methods that compare individual cells, such as t-test, Wilcoxon rank-sum test, logistic regression, negative binomial, Poisson generalized linear models, etc, can misattribute the variance from replicates to the true biological difference, thus producing more false positive DE genes.
Closing
The maze of scRNA-seq differential expression analysis tools is hard to beat. The number of tools will keep increasing, as new tools are being developed and current tools are getting updated frequently. Will we ever find out the best scRNA-Seq DE analysis tool? Probably not. But can we find the most effective tool for our data? Possible. Since the performance of DE analysis is data-specific, a good understanding of our data’s characteristics and the principles of available tools can help us figure out the best choice.
Reference:
- Zappia, L., Phipson, B., & Oshlack, A. (2018). Exploring the single-cell RNA-seq analysis landscape with the scRNA-tools database. PLoS computational biology, 14(6), e1006245.
- Dal Molin, A., Baruzzo, G., & Di Camillo, B. (2017). Single-cell RNA-sequencing: assessment of differential expression analysis methods. Frontiers in genetics, 8, 62.
- Squair, J. W., Gautier, M., Kathe, C., Anderson, M. A., James, N. D., Hutson, T. H., … & Courtine, G. (2021). Confronting false discoveries in single-cell differential expression. Nature communications, 12(1), 1-15.
- Das, S., Rai, A., Merchant, M. L., Cave, M. C., & Rai, S. N. (2021). A Comprehensive Survey of Statistical Approaches for Differential Expression Analysis in Single-Cell RNA Sequencing Studies. Genes, 12(12), 1947.
- Wang, T., Li, B., Nelson, C. E., & Nabavi, S. (2019). Comparative analysis of differential gene expression analysis tools for single-cell RNA sequencing data. BMC bioinformatics, 20(1), 1-16.
- Jiang, R., Sun, T., Song, D., & Li, J. J. (2022). Statistics or biology: the zero-inflation controversy about scRNA-seq data. Genome Biology, 23(1), 1-24.