• Solutions

      For single-cell sequencing data

    • BioTuring Single Cell Browser
      • What is it?
      • Download
      • Request a quote/demo
      • Document
    • Hera-T
    • For RNA sequencing data

    • Hera
    • Other solutions

    • BioVinci
    • Bioinformatics partnerships
  • Resources
    • Webinars
    • Blog
    • Videos
  • Forum
    • Profile
    • Setting
    • Log out
  • navigation
    • About us

    • Solutions

        For single-cell sequencing data

      • BioTuring Single Cell Browser
        • What is it?
        • Download
        • Request a quote/demo
        • Document
      • Hera-T
      • For RNA sequencing data

      • Hera
      • Other solutions

      • BioVinci
      • Bioinformatics partnerships
    • Resources

      • Webinars
      • Blog
      • Videos
    • Forum

    • Careers

    • Contact us

    Log in| Sign up
    1. Home

    BioTuring's Blog

    Data analysis made easy. For biologists, especially.

    Explorer now

    Tag Archives: compare box plots

    Box plots, Data visualization and analysis
    More on how to compare box plots
    by Linh Ngo • May 22, 2018 December 5, 2018

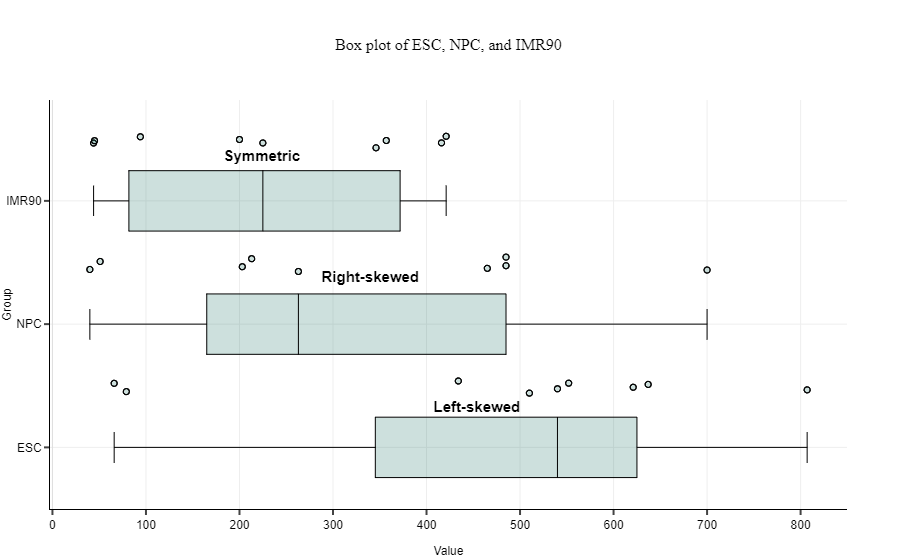
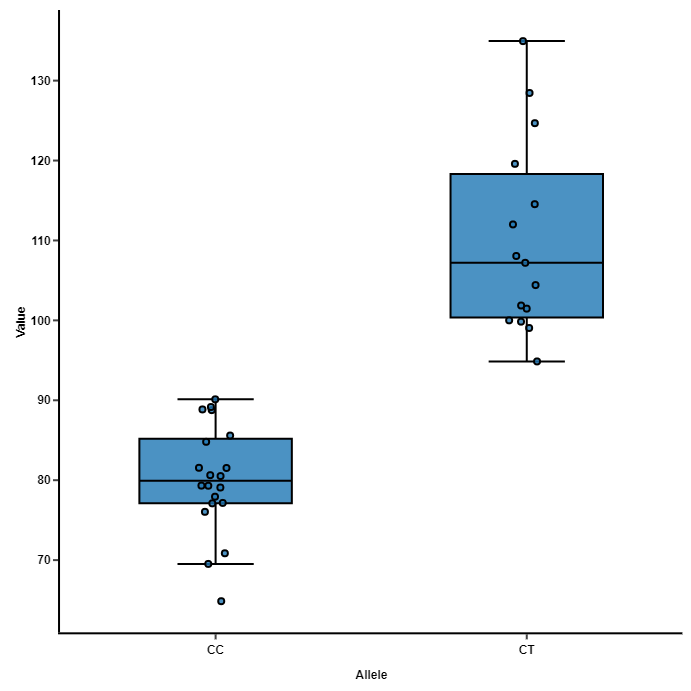
    We showed a quick and easy way to compare box plots in previous post. Let’s dig deeper into what information you can use to compare two box plots. Overlapping boxes and medians It gets tricky when the boxes overlap and their median lines are inside the overlap range. As always, math comes to […]

    Box plots, Data visualization and analysis
    How to compare box plots
    by Linh Ngo • May 22, 2018 December 5, 2018

    Box plots, a.k.a. box-and-whiskers plots, are an excellent way to visualize differences among groups. They manage to carry a lot of statistical details — medians, ranges, outliers — without looking intimidating. But box plots are not always intuitive to read. How do you compare two box plots? The key information […]

    Recent Posts
    • A sub-clustering tutorial: explore T cell subsets with BioTuring Single-cell Browser October 25, 2019
    • A new tool to interactively visualize single-cell objects (Seurat, Scanpy, SingleCellExperiments, …) September 26, 2019
    • 5,500,000 cells will be indexed into BioTuring Single-cell Data Repository this September August 30, 2019
    • 4 simple steps to perform differential expression analysis in single-cell data using BioTuring Browser July 2, 2019
    • Venice: a non-parametric test for finding marker genes in single-cell RNA-seq data June 24, 2019
    Categories
    • Data visualization and analysis
      • Box plots
      • Heatmap
      • k-means clustering
      • Principal component analysis
      • Venn diagrams
      • Violin plots
    • RNA-seq data analysis
    • Single Cell Analysis
    • Single-cell RNA-seq tutorials
    • Uncategorized
    Subscribe now

    We are here to help

    Navigation

    About us
    Contact us
    Sign in
    Blog
    Webinar
    Video
    © 2019 BioTuring. All rights reserved