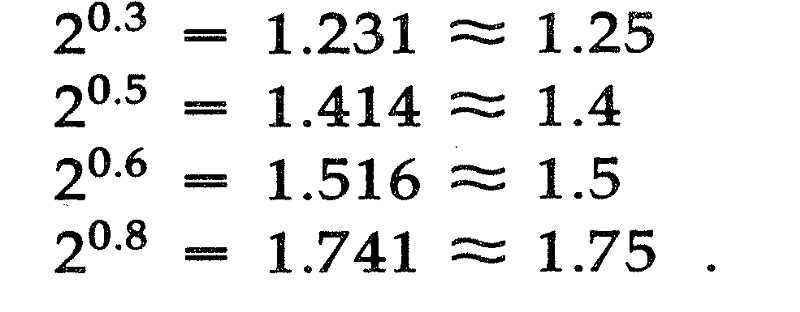
Log base 2 or e or 10?

When your data span a large range, the graphs tend to get ugly. Values either crowd at the bottom or spread out at the top — a problem called poor resolution. The rate of changes is hard to display, since the graph usually has a very long tail, or a very […]
