violin graph Archives - BioTuring's Blog
  • Solutions

      For single-cell sequencing data

    • BioTuring Single Cell Browser
      • What is it?
      • Download
      • Request a quote/demo
      • Document
      • FAQ
    • Hera-T
    • For RNA sequencing data

    • Hera
    • Other solutions

    • BioVinci
    • Bioinformatics partnerships
  • Resources
    • Webinars
    • Blog
    • Videos
  • Forum
    • Profile
    • Setting
    • Log out
  • navigation
    • About us

    • Solutions

        For single-cell sequencing data

      • BioTuring Single Cell Browser
        • What is it?
        • Download
        • Request a quote/demo
        • Document
      • Hera-T
      • For RNA sequencing data

      • Hera
      • Other solutions

      • BioVinci
      • Bioinformatics partnerships
    • Resources

      • Webinars
      • Blog
      • Videos
    • Forum

    • Careers

    • Contact us

    Log in| Sign up
    1. Home

    BioTuring's Blog

    Data analysis made easy. For biologists, especially.

    6,000,000 cells
    at ease with
    BioTuring Browser
    Explore now

    Tag Archives: violin graph

    Data visualization and analysis, Violin plots
    5 reasons you should use a violin graph
    by Linh Ngo • May 16, 2018 December 5, 2018

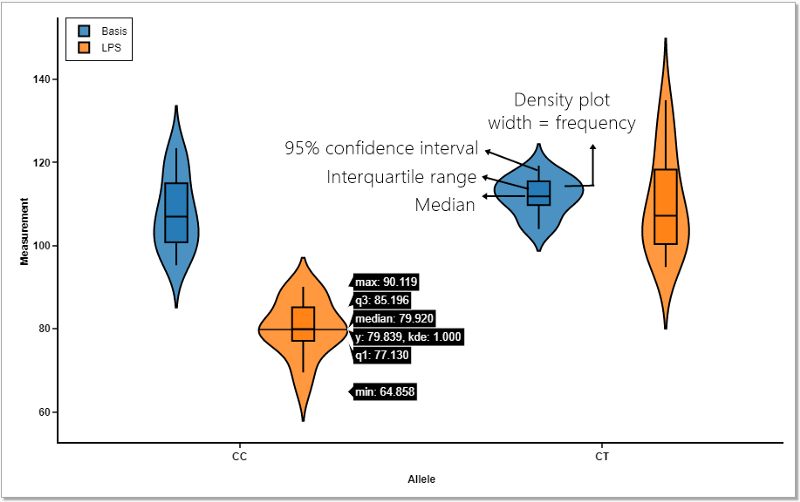
    1. Violin graph is like box plot, but better Box-and-whisker plots are great. They show medians, ranges and variabilities effectively. They allow comparing groups of different sizes. They are super simple to create and read, so naturally, they are all over the place. But box plots can be misleading. They are not […]

    Recent Posts
    • Explore 10X Visium Spatial Transcriptomics data at ease with BioTuring Browser November 9, 2020
    • A tiny world inside non-small cell lung cancer revealed by single-cell omics: 35 cell types, and their marker genes October 20, 2020
    • The Why, When and How of 3D PCA October 12, 2020
    • 6 best box and whisker plot makers September 18, 2020
    • Immunoglobulin genes up-regulated in lung adenocarcinoma infiltrating T cells: A report from BioTuring lung cancer single cell database September 8, 2020
    Categories
    • BioTuring Cellpedia
    • Data visualization and analysis
      • Box plots
      • Heatmap
      • Principal component analysis
      • Venn diagrams
      • Violin plots
    • RNA-seq data analysis
    • Single Cell Analysis
    • Single-cell RNA-seq tutorials
    • Visium Spatial Transcriptomics Analysis
    Subscribe now
    6,000,000 cells
    at ease with
    BioTuring
    Browser
    Explore now

    We are here to help

    Navigation

    About us
    Contact us
    FAQ
    Blog
    Webinar
    Video
    © 2019 BioTuring. All rights reserved