modified box plots Archives - BioTuring's Blog
  • Solutions

      For single-cell sequencing data

    • BioTuring Single Cell Browser
      • What is it?
      • Download
      • Request a quote/demo
      • Document
      • FAQ
    • Hera-T
    • For RNA sequencing data

    • Hera
    • Other solutions

    • BioVinci
    • Bioinformatics partnerships
  • Resources
    • Webinars
    • Blog
    • Videos
  • Forum
    • Profile
    • Setting
    • Log out
  • navigation
    • About us

    • Solutions

        For single-cell sequencing data

      • BioTuring Single Cell Browser
        • What is it?
        • Download
        • Request a quote/demo
        • Document
      • Hera-T
      • For RNA sequencing data

      • Hera
      • Other solutions

      • BioVinci
      • Bioinformatics partnerships
    • Resources

      • Webinars
      • Blog
      • Videos
    • Forum

    • Careers

    • Contact us

    Log in| Sign up
    1. Home

    BioTuring's Blog

    Data analysis made easy. For biologists, especially.

    6,000,000 cells
    at ease with
    BioTuring Browser
    Explore now

    Tag Archives: modified box plots

    Box plots, Data visualization and analysis
    How to compare box plots
    by Linh Ngo • May 22, 2018 September 27, 2020

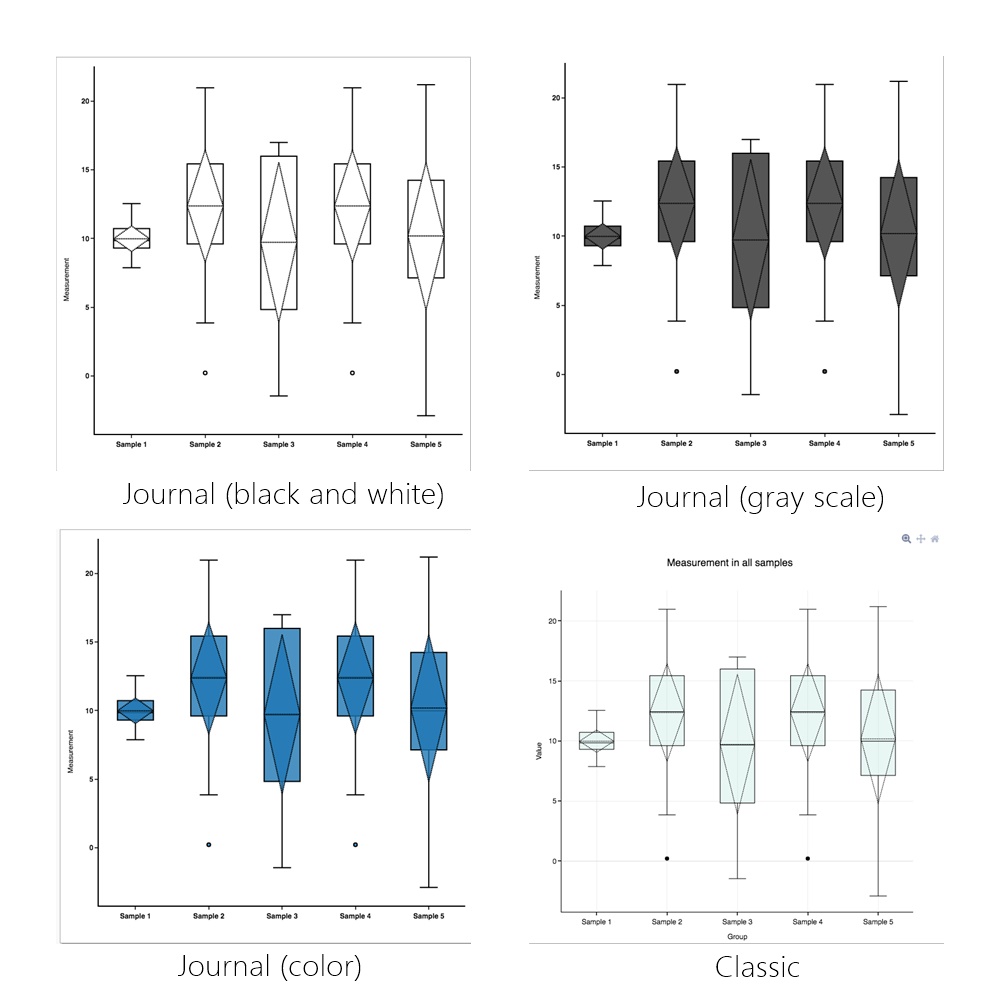
    Box plots, a.k.a. box-and-whiskers plots, are an excellent way to visualize differences among groups. They manage to carry a lot of statistical details — medians, ranges, outliers — without looking intimidating. But box plots are not always intuitive to read. How do you compare two box plots? The key information […]

    Box plots, Data visualization and analysis
    How to draw a modified box plot
    by Linh Ngo • May 13, 2018 December 5, 2018

    Box plots, a.k.a box-and-whisker plots, are an excellent way to compare groups. They are intuitive: viewers can see samples’ medians, distribution, and variabilities with a quick glance. They allow comparing samples of different sizes; for example, a set of 50 data points with a set of 30. They don’t even […]

    Recent Posts
    • Explore 10X Visium Spatial Transcriptomics data at ease with BioTuring Browser November 9, 2020
    • A tiny world inside non-small cell lung cancer revealed by single-cell omics: 35 cell types, and their marker genes October 20, 2020
    • The Why, When and How of 3D PCA October 12, 2020
    • 6 best box and whisker plot makers September 18, 2020
    • Immunoglobulin genes up-regulated in lung adenocarcinoma infiltrating T cells: A report from BioTuring lung cancer single cell database September 8, 2020
    Categories
    • BioTuring Cellpedia
    • Data visualization and analysis
      • Box plots
      • Heatmap
      • Principal component analysis
      • Venn diagrams
      • Violin plots
    • RNA-seq data analysis
    • Single Cell Analysis
    • Single-cell RNA-seq tutorials
    • Visium Spatial Transcriptomics Analysis
    Subscribe now
    6,000,000 cells
    at ease with
    BioTuring
    Browser
    Explore now

    We are here to help

    Navigation

    About us
    Contact us
    FAQ
    Blog
    Webinar
    Video
    © 2019 BioTuring. All rights reserved