BioTuring's Blog - Page 4 of 5 - Data analysis made easy. For biologists, especially.
Data analysis made easy. For biologists, especially.
A review of Haining Lab’s work: Loss of ADAR1 in tumors overcomes resistance to immune checkpoint blockade
#

Ever questioned why the immune system does not attack our own double-stranded RNA? Speaking of this, we should not ignore the role of ADAR, the gene that encodes Double-stranded RNA-specific adenosine deaminase enzyme, responsible for converting adenosines to inosines (A -> I editing) in double-stranded RNA (dsRNA) substrates. ADAR was […]

BioTuring Browser: the software to resolve major challenges in single-cell RNA-seq data analysis
#

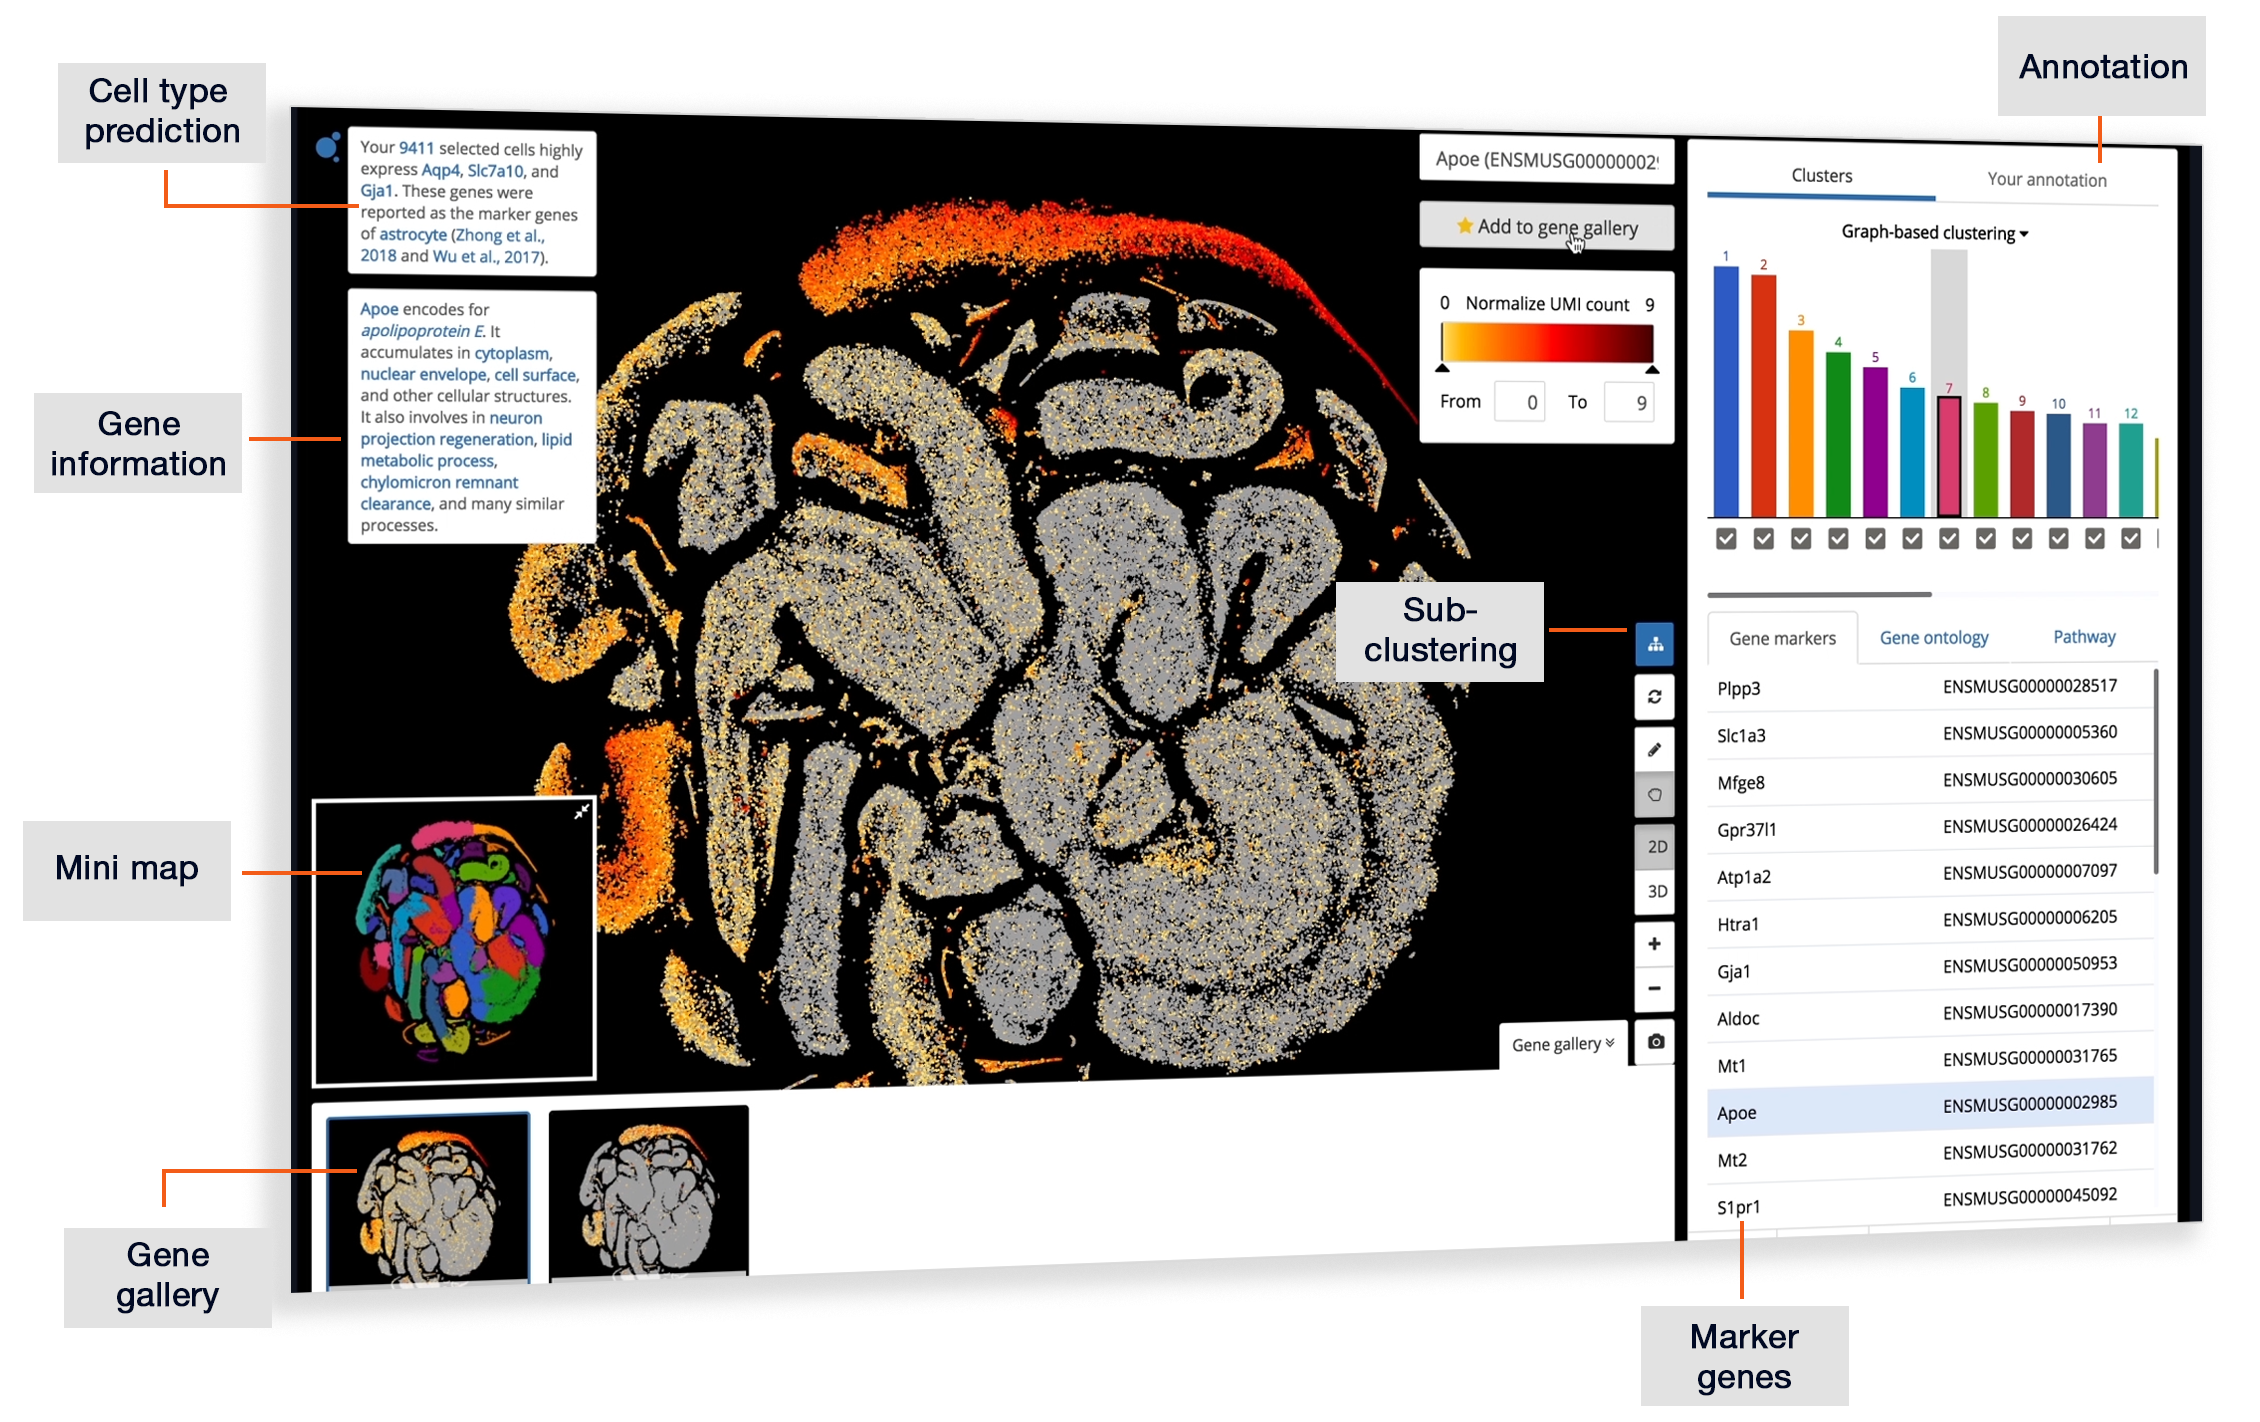
Single-cell RNA-seq technologies have opened up a completely new era for transcriptomic studies. For the first time ever, scientists can look at individual transcriptomic profiles of millions of cells, and better understand how each cell functions in a tissue. Yet science is confronting bigger challenges analyzing these massive amounts of […]

Cell Ranger Problems and Hera-T
#

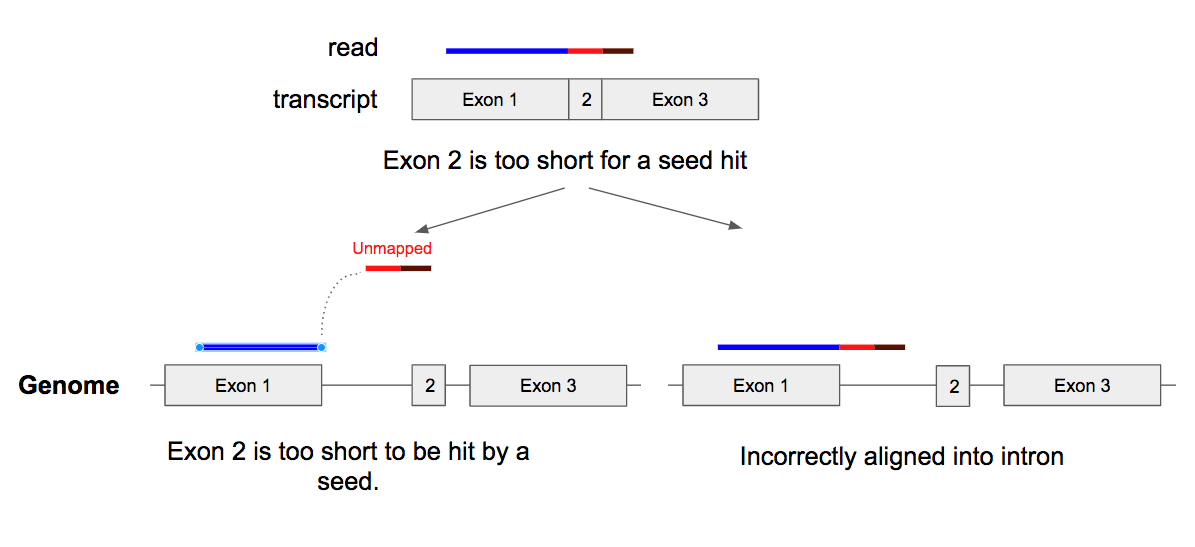
Today we finished the first version of Hera-T, a new single-cell RNA-seq quantification algorithm. We developed Hera-T by improving challenging alignment errors that Cell Ranger has. As a result, Hera-T is more accurate than Cell Ranger. Hera-T is more than 10 times faster than Cell Ranger, while consuming just a small amount of […]

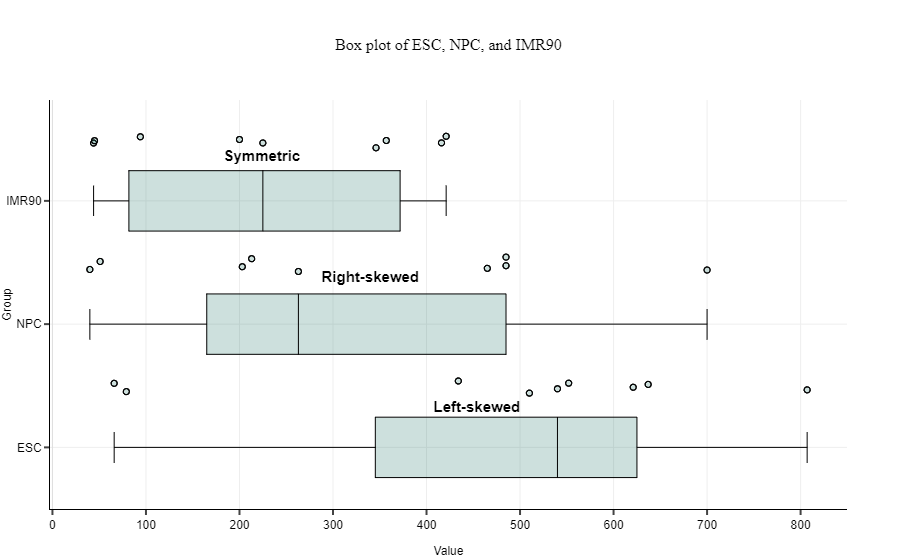
More on how to compare box plots
#

We showed a quick and easy way to compare box plots in previous post. Let’s dig deeper into what information you can use to compare two box plots. Overlapping boxes and medians It gets tricky when the boxes overlap and their median lines are inside the overlap range. As always, math comes to […]

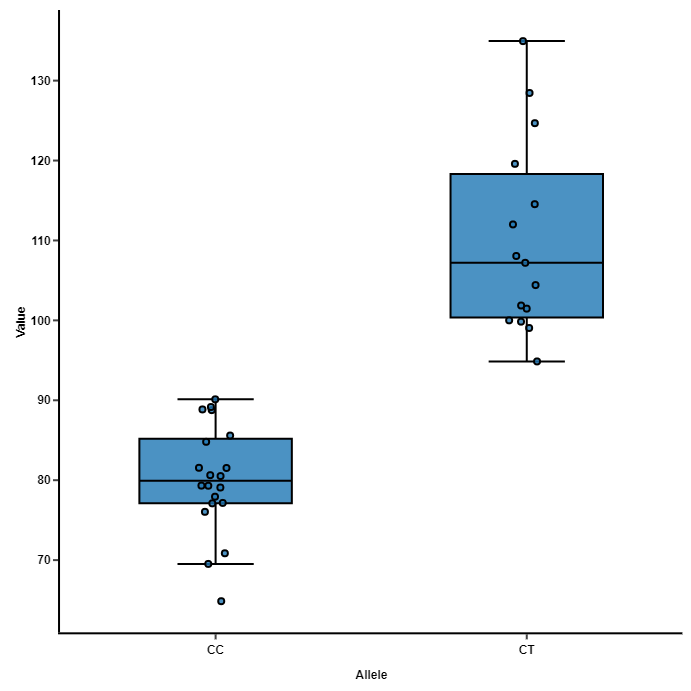
How to compare box plots
#

Box plots, a.k.a. box-and-whiskers plots, are an excellent way to visualize differences among groups. They manage to carry a lot of statistical details — medians, ranges, outliers — without looking intimidating. But box plots are not always intuitive to read. How do you compare two box plots? The key information […]

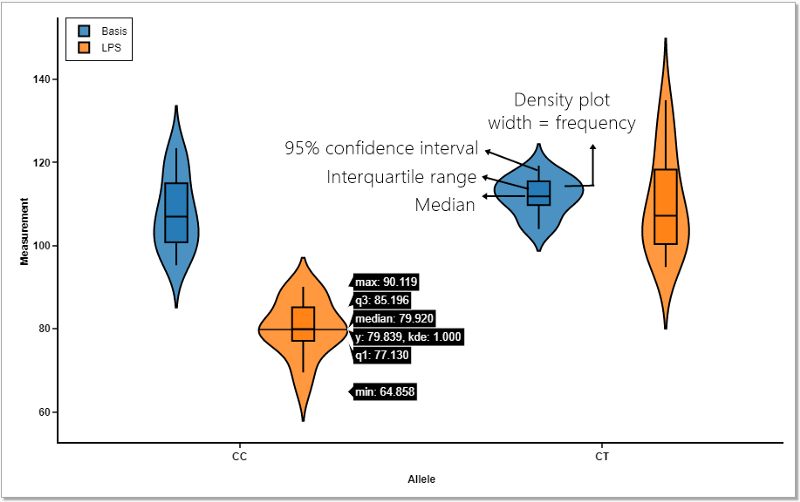
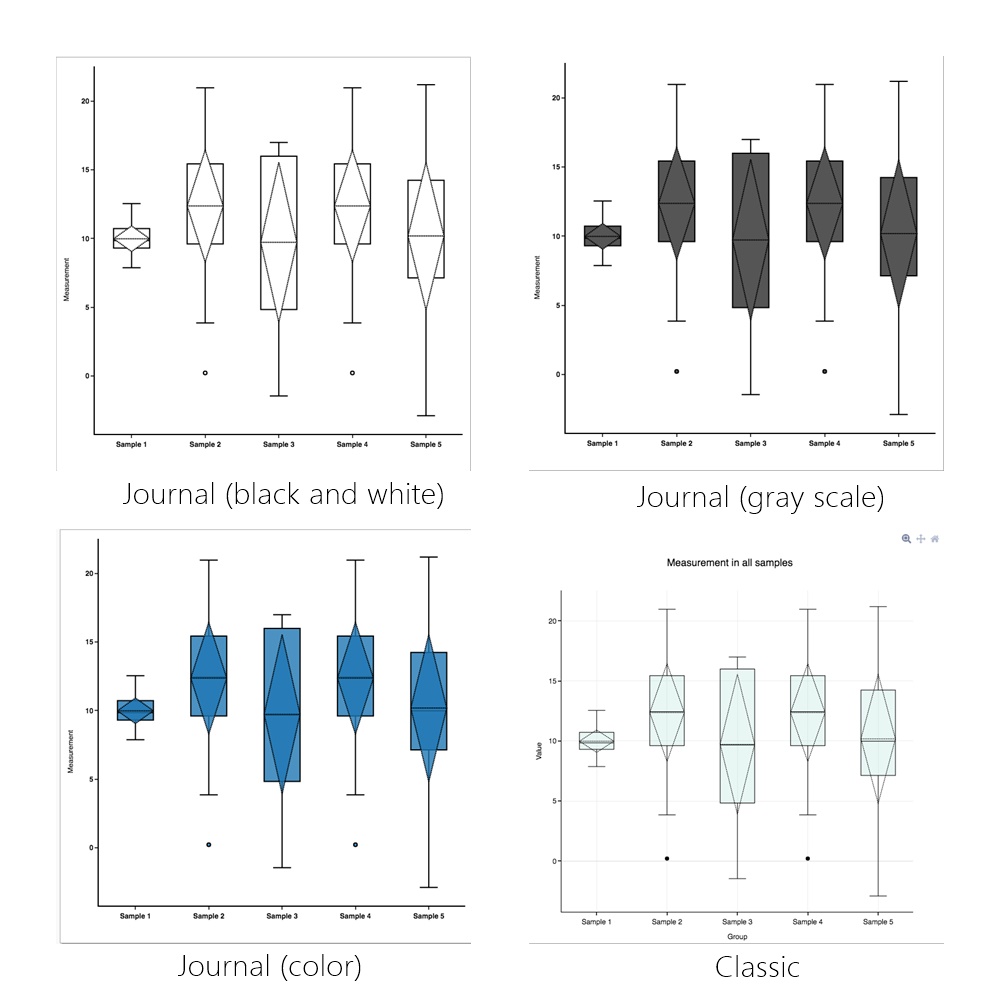
How to draw a modified box plot
#

Box plots, a.k.a box-and-whisker plots, are an excellent way to compare groups. They are intuitive: viewers can see samples’ medians, distribution, and variabilities with a quick glance. They allow comparing samples of different sizes; for example, a set of 50 data points with a set of 30. They don’t even […]